> ## Documentation Index
> Fetch the complete documentation index at: https://docs.cosmosid.com/llms.txt
> Use this file to discover all available pages before exploring further.
# Rarefaction on Cosmos-Hub 2.0
The Rarefaction module produces rarefaction curves that show how Alpha Diversity estimates change as sequencing depth scales.
## Module output and Customization
The Rarefaction Analysis module produces four types of plots:
* [**Alpha diversity vs sequencing depth**](#alpha-diversity-vs-sequencing-depth): scatter plots relating each sample's sequencing depth to its Alpha Diversity value, to visually asses how much diversity estimates is affected by sequencing depth.
* [**Sample retention by read depth**](#sample-retention-by-read-depth): how many samples remain as the read-depth threshold increases, to help choose a depth that balances rigor with sample size.
* [**Alpha diversity rarefaction curves**](#alpha-diversity-rarefaction-curves): mean alpha-diversity assessed at increasing subsampling depths for the whole cohort. Use it to judge whether sequencing depth is sufficient to estimate diversity of your samples.
* [**Grouped alpha diversity rarefaction curves**](#grouped-alpha-diversity-rarefaction-curves): rarefaction curves with alpha-diversity metrics split by a grouping variable. Use it to compare rarefaction patterns across groups.
## Alpha diversity vs sequencing depth
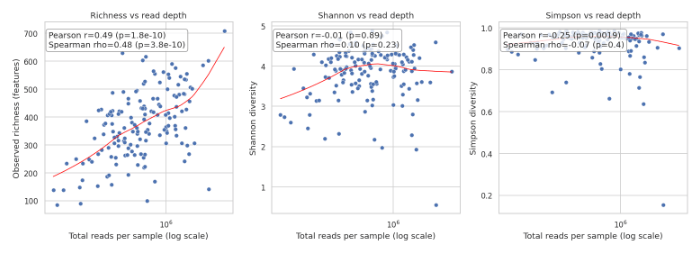 The Alpha diversity vs Sequencing Depth panel shows three scatter plots, one per each alpha-diversity metric currently supported on the Cosmos-Hub 2.0 (Observed Richness, Simpson and Shannon).
Within each scatterplot, the dots represents a single sample of your cohort. Sequencing depth is shown on the x-axis as the total number of reads per sample (displayed in a log10 scale). The y-axis reports different alpha-diversity measures (Observed richness, Shannon and Simpson diversity).
Alpha-diversity can be calculated at different Taxonomic levels. Choose the desired **Taxonomic Rank** from the pre-processing section of the parameters panel to decide at which taxonomic level you want to use as input for alpha-diversity calculation. Selecting a taxonomic rank collapses the counts of all taxa that share the same taxon parent into a single feature. For this reason, alpha-diversity indices calculated on the same dataset are lower at higher taxonomic ranks (such as `phylum`) and higher at lower ranks (such as `species`).
The red fitted line provides shows the overall alpha-diversity change across the range of sequencing depths across the cohort.
**What does a plateauing red fitted line mean?** When the overall trend appears to flatten after a certain number of total reads per sample, it might indicates that increasing sequencing depth does not contribute to the detection of additional features, at a certain taxonomic level. More specifically:
* Observed richness: plateauing at certain read depth, means the number of taxa detected is not influenced after that sequencing level. This suggests that the community is not undersampled. Complex environments (e.g: soil microbiome) or high-resolution taxonomic levels (e.g: species, strain, genes) typically require extremely high sequencing depths in order to exhaust detection of new diversity. If observed richness does not plateau, richness estimates may still be strongly affected by sequencing depth. *If observed richness does not plateau, richness estimates may still be strongly affected by sequencing depth. In that case, interpret group comparisons of richness or other downstream analyses based on feature presence-absence carefully and/or perform rarefaction beforehand.*
* Shannon and Simpsons: plateauing in these two indexes suggests that sequencing depth is enough to estimate community evenness (overall composition). Since evenness-based alpha-diversity indexes keep into account also the abundance proportion at which a taxa appear in the community, it typically stabilize at lower sequencing depth wrt to observed richness.
This is an overview plot. It is computed directly from the current per-sample count table (total reads per sample against alpha-diversity) **before** rarefaction is applied.
### **Why is this plot useful?**
* **Spot unusual samples:**
* Samples that fall far from the overall trend may reflect unusual microbial profiles, technical issues, or sample-specific conditions, for example unexpectedly low or high diversity for a sample's depth, caused by handling, lab processing, contamination, storage, or a true biological shift.
* **Spot uneven sequencing depth:** the position of each dot on the x-axis is its sequencing depth. If most dots cluster in a narrow band and only a few sit at the far left or right, a handful of samples have much lower or higher depth than the rest of the cohort, worth checking before comparing diversity across samples.
## Sample retention by read depth
The Alpha diversity vs Sequencing Depth panel shows three scatter plots, one per each alpha-diversity metric currently supported on the Cosmos-Hub 2.0 (Observed Richness, Simpson and Shannon).
Within each scatterplot, the dots represents a single sample of your cohort. Sequencing depth is shown on the x-axis as the total number of reads per sample (displayed in a log10 scale). The y-axis reports different alpha-diversity measures (Observed richness, Shannon and Simpson diversity).
Alpha-diversity can be calculated at different Taxonomic levels. Choose the desired **Taxonomic Rank** from the pre-processing section of the parameters panel to decide at which taxonomic level you want to use as input for alpha-diversity calculation. Selecting a taxonomic rank collapses the counts of all taxa that share the same taxon parent into a single feature. For this reason, alpha-diversity indices calculated on the same dataset are lower at higher taxonomic ranks (such as `phylum`) and higher at lower ranks (such as `species`).
The red fitted line provides shows the overall alpha-diversity change across the range of sequencing depths across the cohort.
**What does a plateauing red fitted line mean?** When the overall trend appears to flatten after a certain number of total reads per sample, it might indicates that increasing sequencing depth does not contribute to the detection of additional features, at a certain taxonomic level. More specifically:
* Observed richness: plateauing at certain read depth, means the number of taxa detected is not influenced after that sequencing level. This suggests that the community is not undersampled. Complex environments (e.g: soil microbiome) or high-resolution taxonomic levels (e.g: species, strain, genes) typically require extremely high sequencing depths in order to exhaust detection of new diversity. If observed richness does not plateau, richness estimates may still be strongly affected by sequencing depth. *If observed richness does not plateau, richness estimates may still be strongly affected by sequencing depth. In that case, interpret group comparisons of richness or other downstream analyses based on feature presence-absence carefully and/or perform rarefaction beforehand.*
* Shannon and Simpsons: plateauing in these two indexes suggests that sequencing depth is enough to estimate community evenness (overall composition). Since evenness-based alpha-diversity indexes keep into account also the abundance proportion at which a taxa appear in the community, it typically stabilize at lower sequencing depth wrt to observed richness.
This is an overview plot. It is computed directly from the current per-sample count table (total reads per sample against alpha-diversity) **before** rarefaction is applied.
### **Why is this plot useful?**
* **Spot unusual samples:**
* Samples that fall far from the overall trend may reflect unusual microbial profiles, technical issues, or sample-specific conditions, for example unexpectedly low or high diversity for a sample's depth, caused by handling, lab processing, contamination, storage, or a true biological shift.
* **Spot uneven sequencing depth:** the position of each dot on the x-axis is its sequencing depth. If most dots cluster in a narrow band and only a few sit at the far left or right, a handful of samples have much lower or higher depth than the rest of the cohort, worth checking before comparing diversity across samples.
## Sample retention by read depth
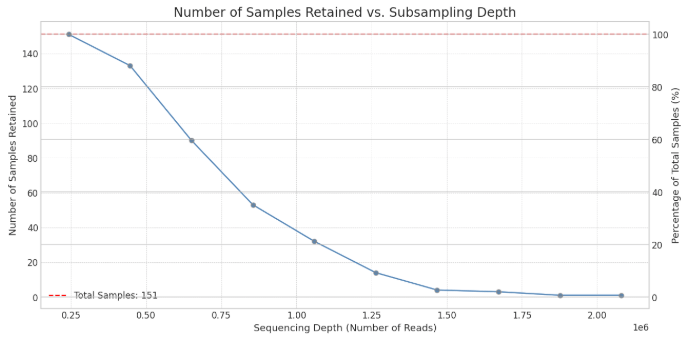 The Sample retention by read depth plot shows, on the y-axis, *how many samples* would be retained from your cohort if you cut it at different minimum sequencing depths (x-axis). In the example above, setting a minimum rarefaction threshold of 10^6 reads would retain only 40 of the 151 samples, because the rest have fewer reads.
### Setting the span of the x-axis
The **Rarefaction Minimum Depth** and **Rarefaction Maximum Depth** parameters set the range of sequencing depth evaluated along the x-axis. **Rarefaction Steps** sets how many depths within that range are evaluated; more steps give a smoother curve.
### **Why is this plot useful?**
* **Choose an appropriate read-depth threshold** for filtering or rarefaction. As the depth increases, fewer samples have enough reads to be retained. This plot makes the trade-off visible: higher depths may improve robustness but reduce sample size, while lower depths retain more samples but include less deeply sequenced profiles.
The Sample retention by read depth plot shows, on the y-axis, *how many samples* would be retained from your cohort if you cut it at different minimum sequencing depths (x-axis). In the example above, setting a minimum rarefaction threshold of 10^6 reads would retain only 40 of the 151 samples, because the rest have fewer reads.
### Setting the span of the x-axis
The **Rarefaction Minimum Depth** and **Rarefaction Maximum Depth** parameters set the range of sequencing depth evaluated along the x-axis. **Rarefaction Steps** sets how many depths within that range are evaluated; more steps give a smoother curve.
### **Why is this plot useful?**
* **Choose an appropriate read-depth threshold** for filtering or rarefaction. As the depth increases, fewer samples have enough reads to be retained. This plot makes the trade-off visible: higher depths may improve robustness but reduce sample size, while lower depths retain more samples but include less deeply sequenced profiles.
Use this trade-off to set the **Data Table Preprocessing Method** in the [PREPROC parameters](/DAP_docs/pre-processing-parameters#data-table-pre-processing-parameters) of other Analysis modules. For a given depth on the x-axis, the curve shows how many samples would be retained if the data were rarefied to that depth, since any sample with fewer reads than the threshold is dropped. A higher threshold keeps more reads per sample but retains fewer samples.
## Alpha Diversity Rarefaction Curves
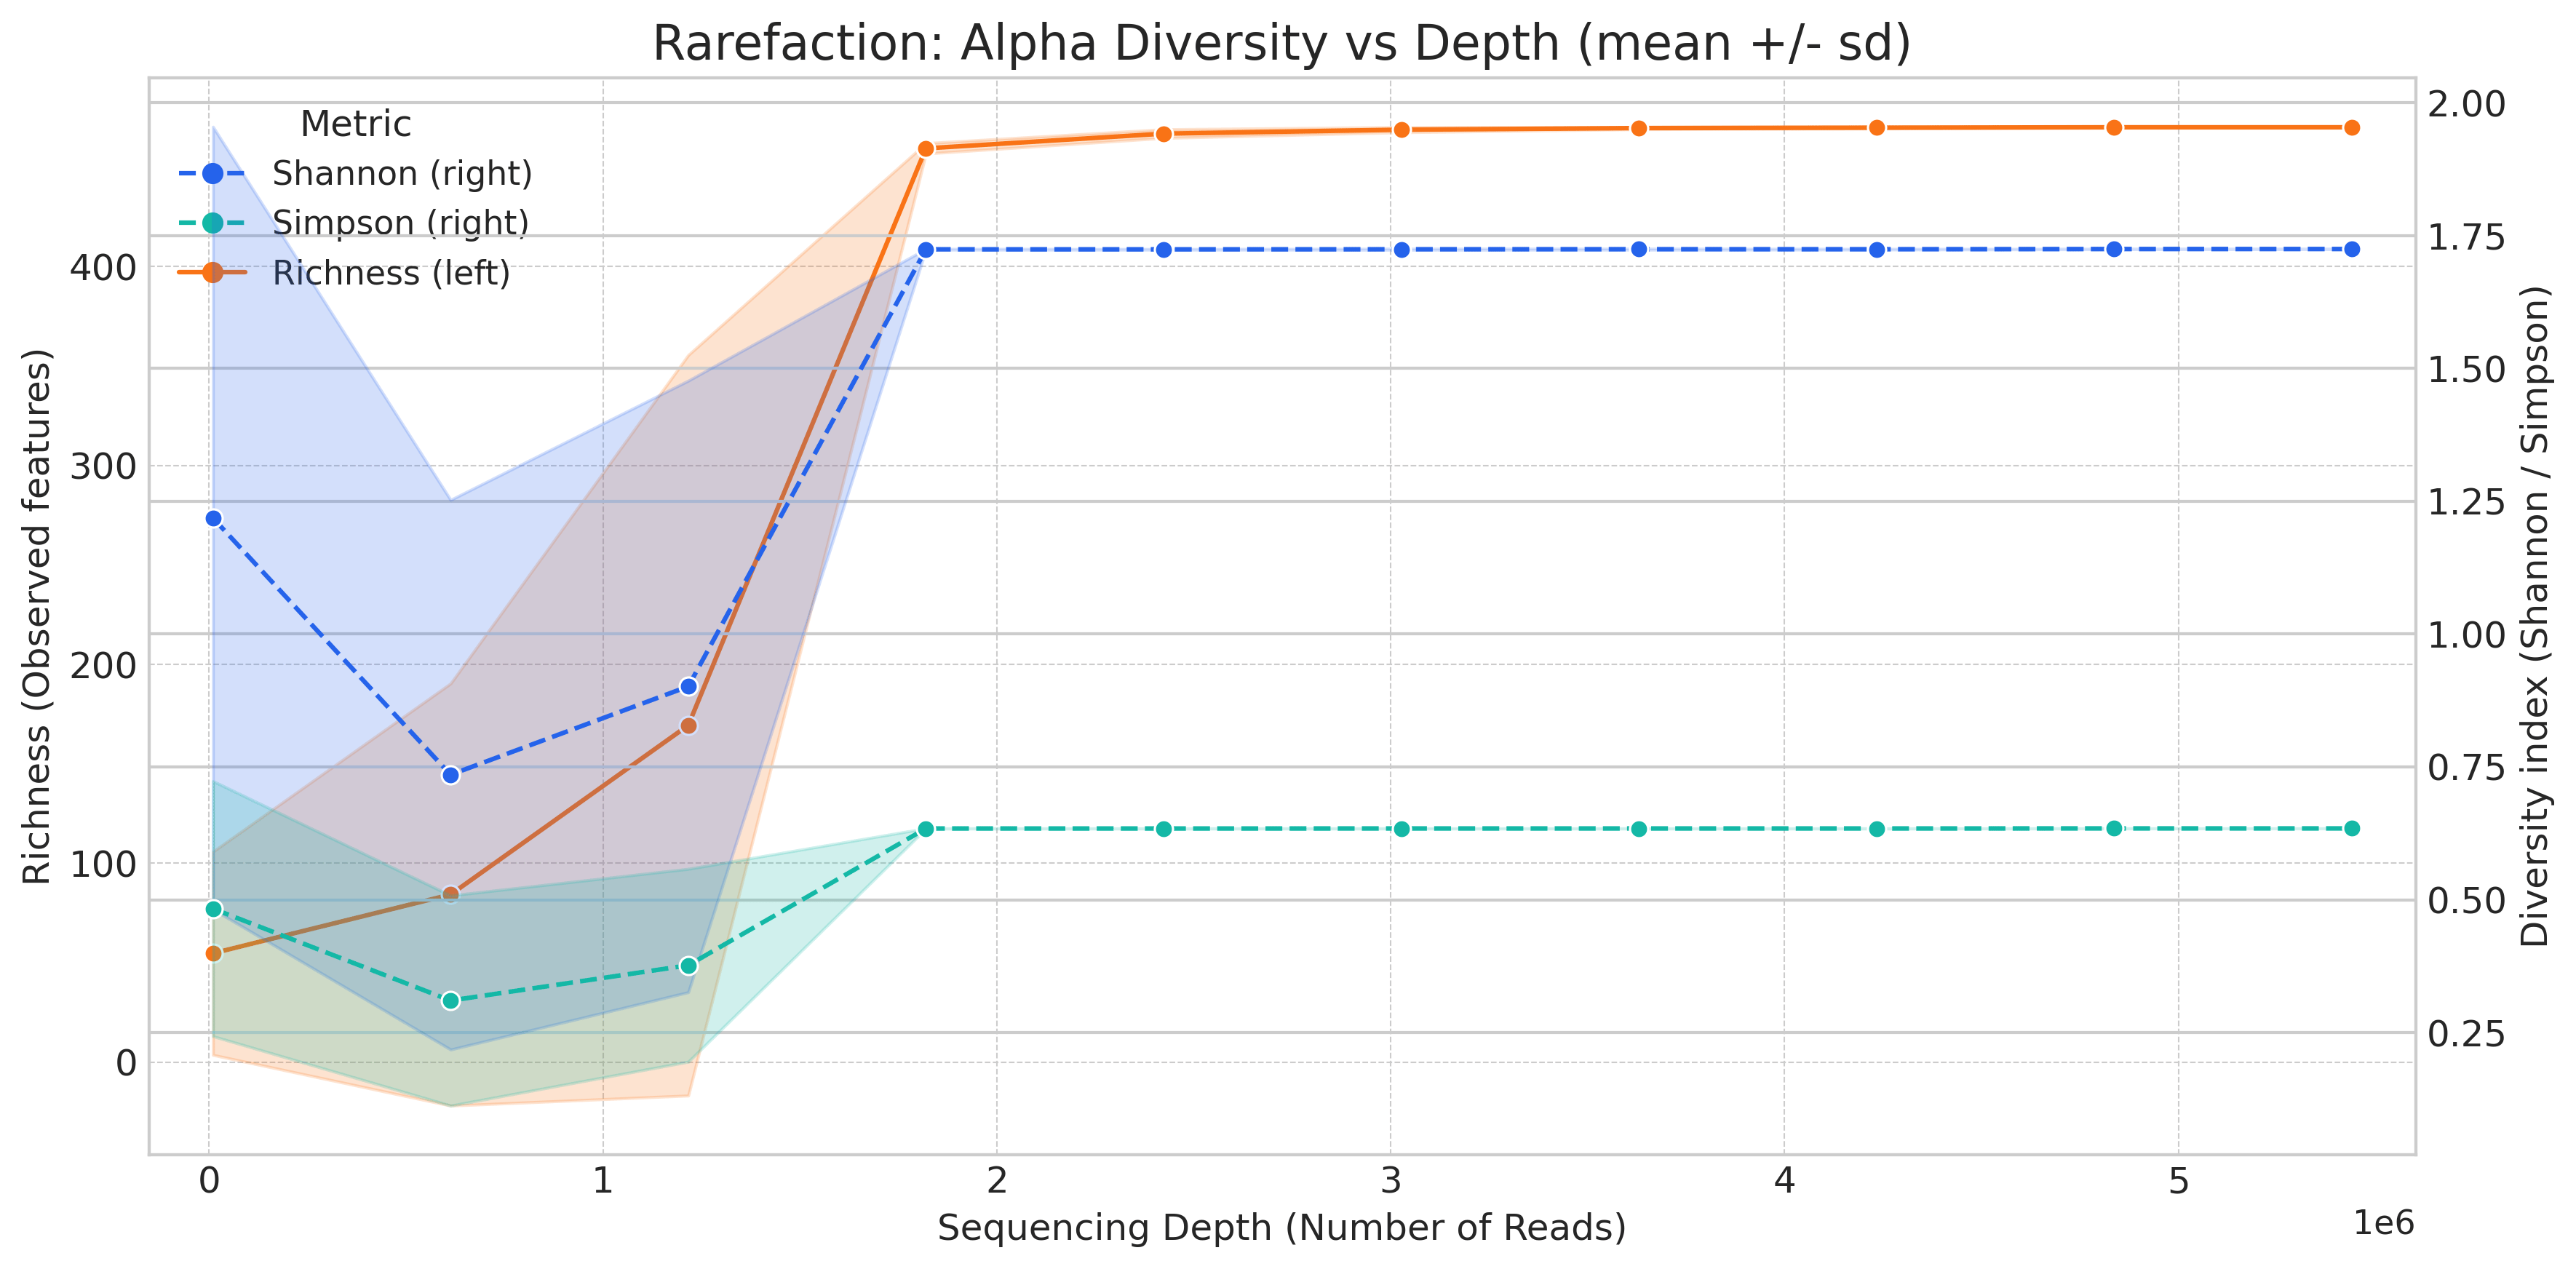 Each dot is the mean alpha-diversity across samples at one evaluated subsampling depth; the dots are joined into a line, and the shaded band shows ± one standard deviation. A line that flattens means most detectable diversity has been captured, while a line that keeps rising means the estimate still depends on sequencing depth.
**Rarefaction Minimum Depth** and **Rarefaction Maximum Depth** set where the curve starts and ends on the x-axis, and **Rarefaction Steps** sets how many depths are evaluated between them. **Iterations** sets how many times each depth is subsampled before averaging, so more iterations give steadier points and a tighter band, while the **Rarefaction Seed** fixes that subsampling so the result is reproducible. The **Taxonomic Rank** sets what counts as a feature, shifting the height of the whole curve, with finer ranks giving higher values.
### **Why is this plot useful?**
* **Evaluate whether sequencing depth is sufficient** to capture alpha diversity in your cohort. As a curve approaches a plateau, that metric's estimate stabilizes, meaning deeper sequencing would change it little. What this tells you depends on the metric: when **observed richness** plateaus, the depth is enough to detect most of the features present, including rarer ones; when **Shannon** or **Simpson** plateaus, the depth is enough to capture the community's composition, the balance of its dominant members, which these metrics weight most heavily. Because richness is the most depth-sensitive of the three, it usually plateaus last. Curves that keep climbing suggest the estimate still depends on sequencing depth.
**Plan sequencing depth for scale-up**
In a pilot study, these curves help you choose a sequencing depth before scaling up. Sequence a few samples deeply, run the rarefaction analysis, and look for the depth at which the curve starts to flatten, which should correspond to where increase sequencing depth reads is not useful to detect new features at a specified taxonomic level.
Sequencing the rest of your samples at around that depth is usually enough to capture the diversity detectable at the chosen taxonomic rank, without spending reads on diminishing returns. Keep in mind that the plateau depends on both the sample type and the taxonomic rank: a depth that saturates at `phylum` may still be too shallow at `species`, so choose the depth based on the rank you plan to analyse.
## Grouped alpha diversity rarefaction curves
Each dot is the mean alpha-diversity across samples at one evaluated subsampling depth; the dots are joined into a line, and the shaded band shows ± one standard deviation. A line that flattens means most detectable diversity has been captured, while a line that keeps rising means the estimate still depends on sequencing depth.
**Rarefaction Minimum Depth** and **Rarefaction Maximum Depth** set where the curve starts and ends on the x-axis, and **Rarefaction Steps** sets how many depths are evaluated between them. **Iterations** sets how many times each depth is subsampled before averaging, so more iterations give steadier points and a tighter band, while the **Rarefaction Seed** fixes that subsampling so the result is reproducible. The **Taxonomic Rank** sets what counts as a feature, shifting the height of the whole curve, with finer ranks giving higher values.
### **Why is this plot useful?**
* **Evaluate whether sequencing depth is sufficient** to capture alpha diversity in your cohort. As a curve approaches a plateau, that metric's estimate stabilizes, meaning deeper sequencing would change it little. What this tells you depends on the metric: when **observed richness** plateaus, the depth is enough to detect most of the features present, including rarer ones; when **Shannon** or **Simpson** plateaus, the depth is enough to capture the community's composition, the balance of its dominant members, which these metrics weight most heavily. Because richness is the most depth-sensitive of the three, it usually plateaus last. Curves that keep climbing suggest the estimate still depends on sequencing depth.
**Plan sequencing depth for scale-up**
In a pilot study, these curves help you choose a sequencing depth before scaling up. Sequence a few samples deeply, run the rarefaction analysis, and look for the depth at which the curve starts to flatten, which should correspond to where increase sequencing depth reads is not useful to detect new features at a specified taxonomic level.
Sequencing the rest of your samples at around that depth is usually enough to capture the diversity detectable at the chosen taxonomic rank, without spending reads on diminishing returns. Keep in mind that the plateau depends on both the sample type and the taxonomic rank: a depth that saturates at `phylum` may still be too shallow at `species`, so choose the depth based on the rank you plan to analyse.
## Grouped alpha diversity rarefaction curves
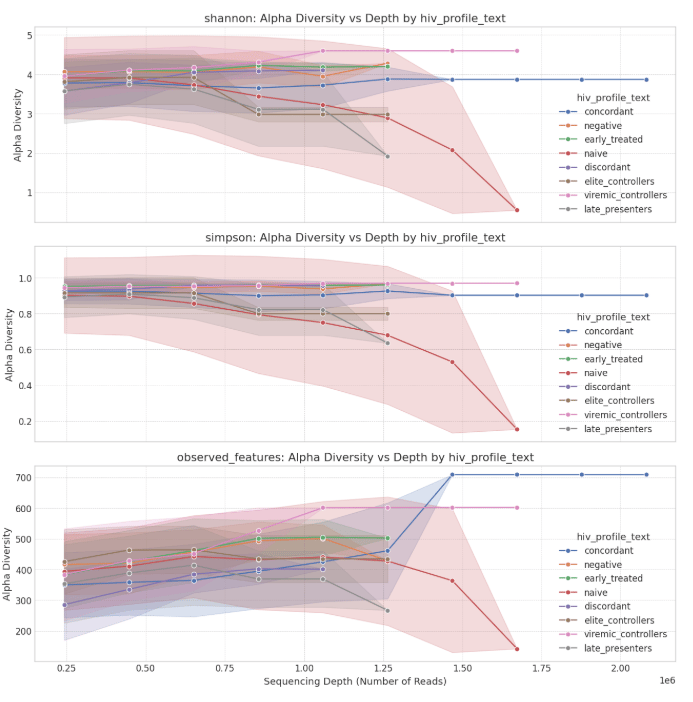 This output is the same rarefaction curve as above, but split by sample group instead of pooled across the whole cohort. Each panel is one alpha-diversity metric, and within a panel each line is the mean curve for one group, with the shaded area showing within-group variability. The split is controlled by the **Grouping Variable** parameter: choose a categorical metadata column (for example treatment or body site) to draw one curve per category. The **Drop samples with missing grouping metadata** parameter decides whether samples without a value for that variable are removed or kept as a separate group (displayed as a separate line labelled 'NaN\_group').
### **Why is this plot useful?**
* **Assess group-level rarefaction patterns.** When comparing groups, check whether alpha-diversity differences are consistent across depths. Stable differences are more likely to reflect real community structure, while differences that appear only at low depth may be driven by under-sampling.
* **Verify that the chosen depth for rarefaction doesn't exclude a whole group.** When rarefaction is applied, samples below the chosen threshold are discarded. If every sample in a group (a treatment, time point, or cohort) has low depth, the entire group may be removed from downstream analyses. Before proceeding, confirm a minimum number of samples per group is retained. If a group is at risk, consider lowering the rarefaction depth or investigating why those samples have lower sequencing depth.
## Recommended parameters
| Parameter | Recommended value |
| :------------------------------------------------------------- | :------------------------------------- |
| Taxonomic Rank | `species` |
| Rarefaction Minimum Depth | `default` ( cohort minimum read depth) |
| Rarefaction Maximum Depth | `default` ( cohort maximum read depth) |
| Rarefaction Steps | `10` |
| Iterations | `5` |
| Rarefaction seed | `default` |
| Grouping Variable | Metadata of interest |
| Drop samples with missing metadata values in grouping variable | ✅ |
| Parameter | Recommended value |
| :------------------------------------------------------------- | :------------------------------------- |
| Taxonomic Rank | `species` |
| Rarefaction Minimum Depth | `default` ( cohort minimum read depth) |
| Rarefaction Maximum Depth | `default` ( cohort maximum read depth) |
| Rarefaction Steps | `10` |
| Iterations | `5` |
| Rarefaction seed | `default` |
| Grouping Variable | Metadata of interest |
| Drop samples with missing metadata values in grouping variable | ✅ |
| Parameter | Recommended value |
| :------------------------------------------------------------- | :------------------------------------- |
| Taxonomic Rank | `genus` |
| Rarefaction Minimum Depth | `default` ( cohort minimum read depth) |
| Rarefaction Maximum Depth | `default` ( cohort maximum read depth) |
| Rarefaction Steps | `10` |
| Iterations | `5` |
| Rarefaction seed | `default` |
| Grouping Variable | Metadata of interest |
| Drop samples with missing metadata values in grouping variable | ✅ |
| Parameter | Recommended value |
| :------------------------------------------------------------- | :------------------------------------- |
| Taxonomic Rank | `species` |
| Rarefaction Minimum Depth | `default` ( cohort minimum read depth) |
| Rarefaction Maximum Depth | `default` ( cohort maximum read depth) |
| Rarefaction Steps | `10` |
| Iterations | `5` |
| Rarefaction seed | `default` |
| Grouping Variable | Metadata of interest |
| Drop samples with missing metadata values in grouping variable | ✅ |
## Parameters reference
The taxonomic level at which microbial features are aggregated before running rarefaction.
* **Options** · `kingdom`, `phylum`, `class`, `order`, `family`, `genus`, `species`
* **Default** · `species`
The selected rank defines what taxon counts as an observed feature in the curve. Lower ranks such as `species` give more detailed richness estimates but are more sensitive to annotation uncertainty and sparse data. Higher ranks such as `phylum` or `family` give broader compositional taxonomic summaries but hide biologically relevant differences.
The lowest sequencing depth used as the starting point of the rarefaction curves.
* **Options** · Integer value
* **Default** · Minimum number of reads observed across samples in the dataset
**Example** · With a minimum depth of `10,000`, the first point of the curve estimates how many features are observed after subsampling each sample to 10,000 reads.
Samples with a read depth below the **Rarefaction Minimum Depth** are excluded before rarefaction runs.
The highest sequencing depth used as the endpoint of the rarefaction curves.
* **Options** · Integer value
* **Default** · Maximum number of reads observed across samples in the dataset
The number of depth intervals evaluated between the minimum and maximum rarefaction depth.
* **Options** · Integer value
* **Default** · `10`
* **Suggested** · 3 to 15, fewer steps for quick exploratory analyses, more for smoother curves
More steps create smoother curves but may increase computation time. When samples have similar depths or the depth range is narrow, fewer steps are usually enough.
**Example** · With a minimum depth of `100,000` reads and a maximum of `1,000,000`, setting `10` steps divides the range into 10 evaluated depths.
The number of repeated subsampling iterations performed at each rarefaction depth.
* **Options** · Integer value
* **Default** · `5`
* **Suggested** · 3 to 10, fewer for faster exploratory analysis, more for more stable curves
Rarefaction involves random subsampling. Repeating it several times at each depth reduces the effect of random variation. More iterations make the curves more stable but increase runtime.
The random seed used during rarefaction subsampling. Because rarefaction randomly subsamples reads, the seed fixes that randomness: running the same analysis with the same seed and parameters always produces the same result.
* **Options** · Integer value
* **Default** · `42`
There is no "best" seed. Any value gives an equally valid subsample. What matters is that you **keep track of the seed you used**, so you (or anyone else) can reproduce the same result later. To test how robust your results are, change the seed deliberately and note which values you tried.
The metadata column used to group samples in the grouped rarefaction outputs.
* **Options**: Categorical variables from the metadata table associated with the query used to create the analysis
* **Default** : `None`
* **Suggested**: A biologically meaningful categorical variable, such as `treatment`, `condition`, `disease status`, `body site`, `cohort`, `time point`, or `ethnicity`
The grouping variable lets you compare rarefaction trends across sample groups, for example whether disease and control samples reach a richness plateau at similar sequencing depths.
Whether samples with missing values in the selected grouping variable are removed from grouped outputs.
**Options** · `TRUE` or `FALSE`
**Default** · `TRUE`
If enabled, samples with missing grouping metadata are removed. If disabled, they are kept and assigned to a default missing-value group. The best choice depends on sample size and whether missing metadata is meaningful for your analysis.
This output is the same rarefaction curve as above, but split by sample group instead of pooled across the whole cohort. Each panel is one alpha-diversity metric, and within a panel each line is the mean curve for one group, with the shaded area showing within-group variability. The split is controlled by the **Grouping Variable** parameter: choose a categorical metadata column (for example treatment or body site) to draw one curve per category. The **Drop samples with missing grouping metadata** parameter decides whether samples without a value for that variable are removed or kept as a separate group (displayed as a separate line labelled 'NaN\_group').
### **Why is this plot useful?**
* **Assess group-level rarefaction patterns.** When comparing groups, check whether alpha-diversity differences are consistent across depths. Stable differences are more likely to reflect real community structure, while differences that appear only at low depth may be driven by under-sampling.
* **Verify that the chosen depth for rarefaction doesn't exclude a whole group.** When rarefaction is applied, samples below the chosen threshold are discarded. If every sample in a group (a treatment, time point, or cohort) has low depth, the entire group may be removed from downstream analyses. Before proceeding, confirm a minimum number of samples per group is retained. If a group is at risk, consider lowering the rarefaction depth or investigating why those samples have lower sequencing depth.
## Recommended parameters
| Parameter | Recommended value |
| :------------------------------------------------------------- | :------------------------------------- |
| Taxonomic Rank | `species` |
| Rarefaction Minimum Depth | `default` ( cohort minimum read depth) |
| Rarefaction Maximum Depth | `default` ( cohort maximum read depth) |
| Rarefaction Steps | `10` |
| Iterations | `5` |
| Rarefaction seed | `default` |
| Grouping Variable | Metadata of interest |
| Drop samples with missing metadata values in grouping variable | ✅ |
| Parameter | Recommended value |
| :------------------------------------------------------------- | :------------------------------------- |
| Taxonomic Rank | `species` |
| Rarefaction Minimum Depth | `default` ( cohort minimum read depth) |
| Rarefaction Maximum Depth | `default` ( cohort maximum read depth) |
| Rarefaction Steps | `10` |
| Iterations | `5` |
| Rarefaction seed | `default` |
| Grouping Variable | Metadata of interest |
| Drop samples with missing metadata values in grouping variable | ✅ |
| Parameter | Recommended value |
| :------------------------------------------------------------- | :------------------------------------- |
| Taxonomic Rank | `genus` |
| Rarefaction Minimum Depth | `default` ( cohort minimum read depth) |
| Rarefaction Maximum Depth | `default` ( cohort maximum read depth) |
| Rarefaction Steps | `10` |
| Iterations | `5` |
| Rarefaction seed | `default` |
| Grouping Variable | Metadata of interest |
| Drop samples with missing metadata values in grouping variable | ✅ |
| Parameter | Recommended value |
| :------------------------------------------------------------- | :------------------------------------- |
| Taxonomic Rank | `species` |
| Rarefaction Minimum Depth | `default` ( cohort minimum read depth) |
| Rarefaction Maximum Depth | `default` ( cohort maximum read depth) |
| Rarefaction Steps | `10` |
| Iterations | `5` |
| Rarefaction seed | `default` |
| Grouping Variable | Metadata of interest |
| Drop samples with missing metadata values in grouping variable | ✅ |
## Parameters reference
The taxonomic level at which microbial features are aggregated before running rarefaction.
* **Options** · `kingdom`, `phylum`, `class`, `order`, `family`, `genus`, `species`
* **Default** · `species`
The selected rank defines what taxon counts as an observed feature in the curve. Lower ranks such as `species` give more detailed richness estimates but are more sensitive to annotation uncertainty and sparse data. Higher ranks such as `phylum` or `family` give broader compositional taxonomic summaries but hide biologically relevant differences.
The lowest sequencing depth used as the starting point of the rarefaction curves.
* **Options** · Integer value
* **Default** · Minimum number of reads observed across samples in the dataset
**Example** · With a minimum depth of `10,000`, the first point of the curve estimates how many features are observed after subsampling each sample to 10,000 reads.
Samples with a read depth below the **Rarefaction Minimum Depth** are excluded before rarefaction runs.
The highest sequencing depth used as the endpoint of the rarefaction curves.
* **Options** · Integer value
* **Default** · Maximum number of reads observed across samples in the dataset
The number of depth intervals evaluated between the minimum and maximum rarefaction depth.
* **Options** · Integer value
* **Default** · `10`
* **Suggested** · 3 to 15, fewer steps for quick exploratory analyses, more for smoother curves
More steps create smoother curves but may increase computation time. When samples have similar depths or the depth range is narrow, fewer steps are usually enough.
**Example** · With a minimum depth of `100,000` reads and a maximum of `1,000,000`, setting `10` steps divides the range into 10 evaluated depths.
The number of repeated subsampling iterations performed at each rarefaction depth.
* **Options** · Integer value
* **Default** · `5`
* **Suggested** · 3 to 10, fewer for faster exploratory analysis, more for more stable curves
Rarefaction involves random subsampling. Repeating it several times at each depth reduces the effect of random variation. More iterations make the curves more stable but increase runtime.
The random seed used during rarefaction subsampling. Because rarefaction randomly subsamples reads, the seed fixes that randomness: running the same analysis with the same seed and parameters always produces the same result.
* **Options** · Integer value
* **Default** · `42`
There is no "best" seed. Any value gives an equally valid subsample. What matters is that you **keep track of the seed you used**, so you (or anyone else) can reproduce the same result later. To test how robust your results are, change the seed deliberately and note which values you tried.
The metadata column used to group samples in the grouped rarefaction outputs.
* **Options**: Categorical variables from the metadata table associated with the query used to create the analysis
* **Default** : `None`
* **Suggested**: A biologically meaningful categorical variable, such as `treatment`, `condition`, `disease status`, `body site`, `cohort`, `time point`, or `ethnicity`
The grouping variable lets you compare rarefaction trends across sample groups, for example whether disease and control samples reach a richness plateau at similar sequencing depths.
Whether samples with missing values in the selected grouping variable are removed from grouped outputs.
**Options** · `TRUE` or `FALSE`
**Default** · `TRUE`
If enabled, samples with missing grouping metadata are removed. If disabled, they are kept and assigned to a default missing-value group. The best choice depends on sample size and whether missing metadata is meaningful for your analysis.