> ## Documentation Index
> Fetch the complete documentation index at: https://docs.cosmosid.com/llms.txt
> Use this file to discover all available pages before exploring further.
# Bubble Graph
## What is a bubble graph?
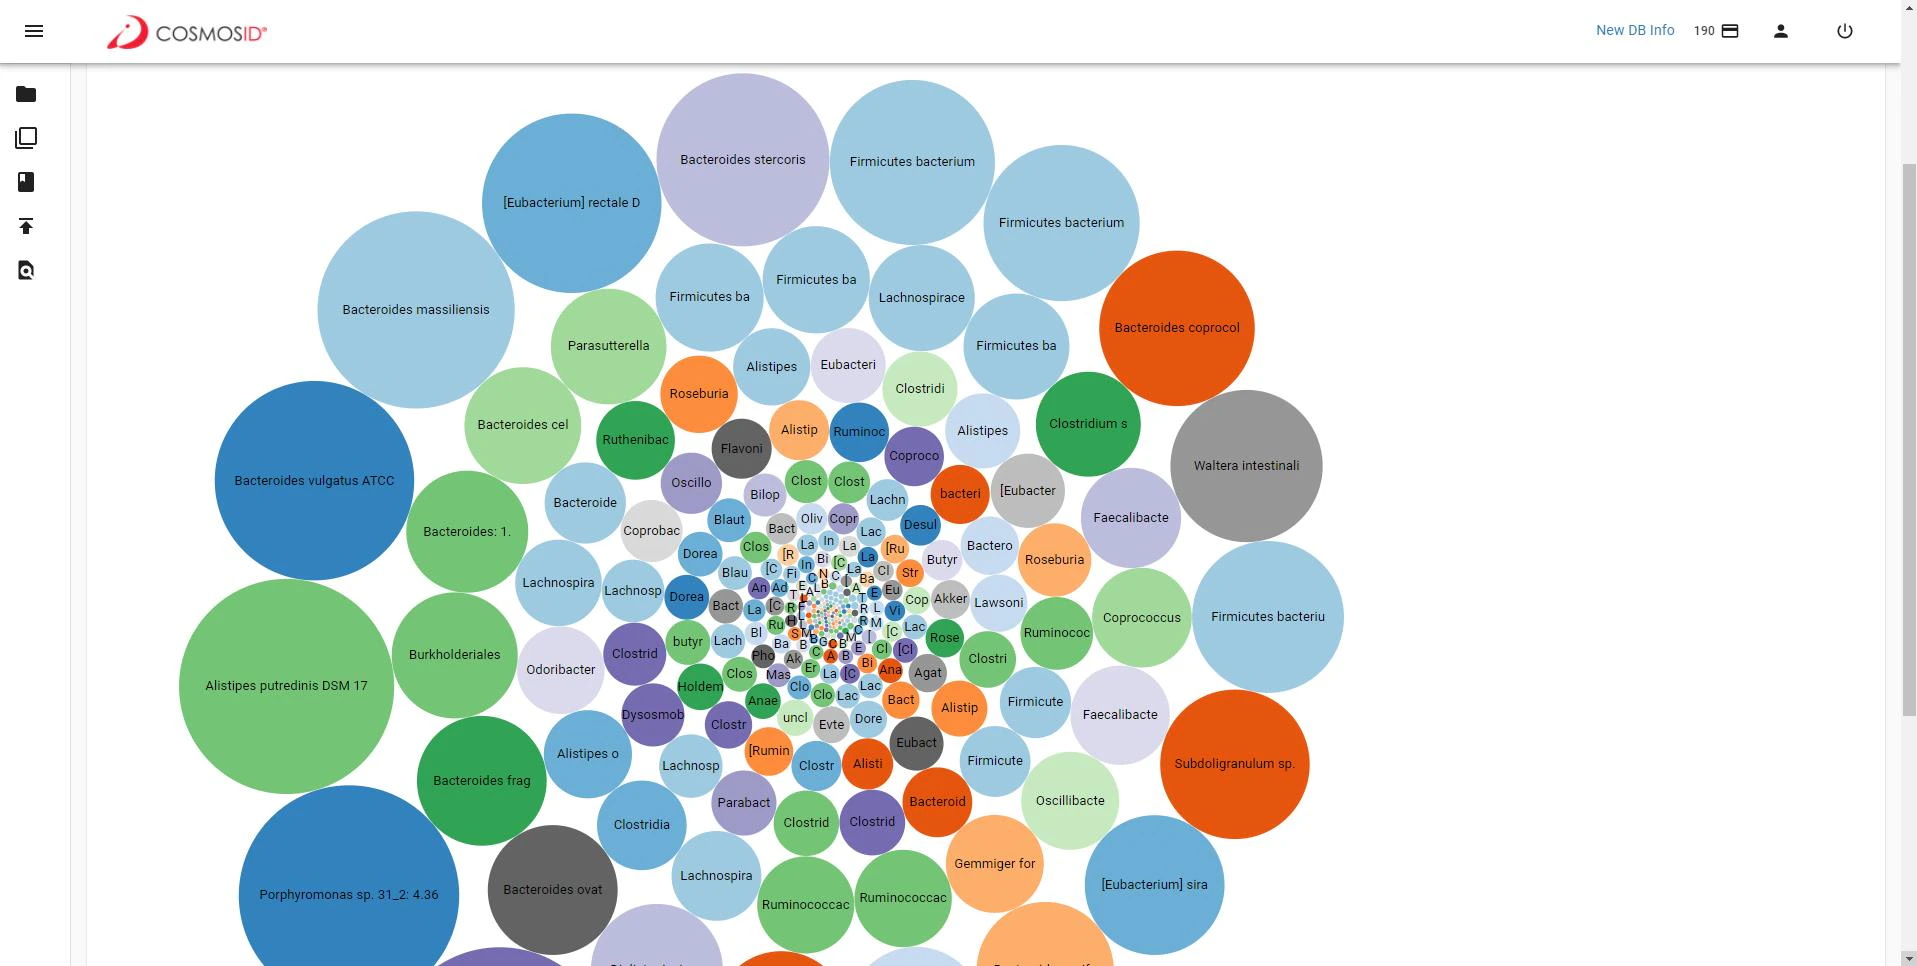
A bubble graph shows the different organisms identified in your sample based on their relative abundance.
 ## When to use a bubble graph
It is useful for looking at the distribution of abundance - is the sample composed of a few organisms that are present at a high abundance and many organisms at a much lower abundance or are the organisms present at equal abundances, for example.
## When to use a bubble graph
It is useful for looking at the distribution of abundance - is the sample composed of a few organisms that are present at a high abundance and many organisms at a much lower abundance or are the organisms present at equal abundances, for example.