> ## Documentation Index
> Fetch the complete documentation index at: https://docs.cosmosid.com/llms.txt
> Use this file to discover all available pages before exploring further.
# The Study Dashboard
> How to navigate all resources and tools inside a study: Analysis Projects, Data Tables, sample metadata, files and running jobs.
Opening a Study leads to the Study Dashboard. The Study Dashboard gives access to the Analysis Projects, the Feature Data Tables and sample metadata, the Study storage drive, and the status of the analyses and data imports running in the Study.
## Analysis Projects
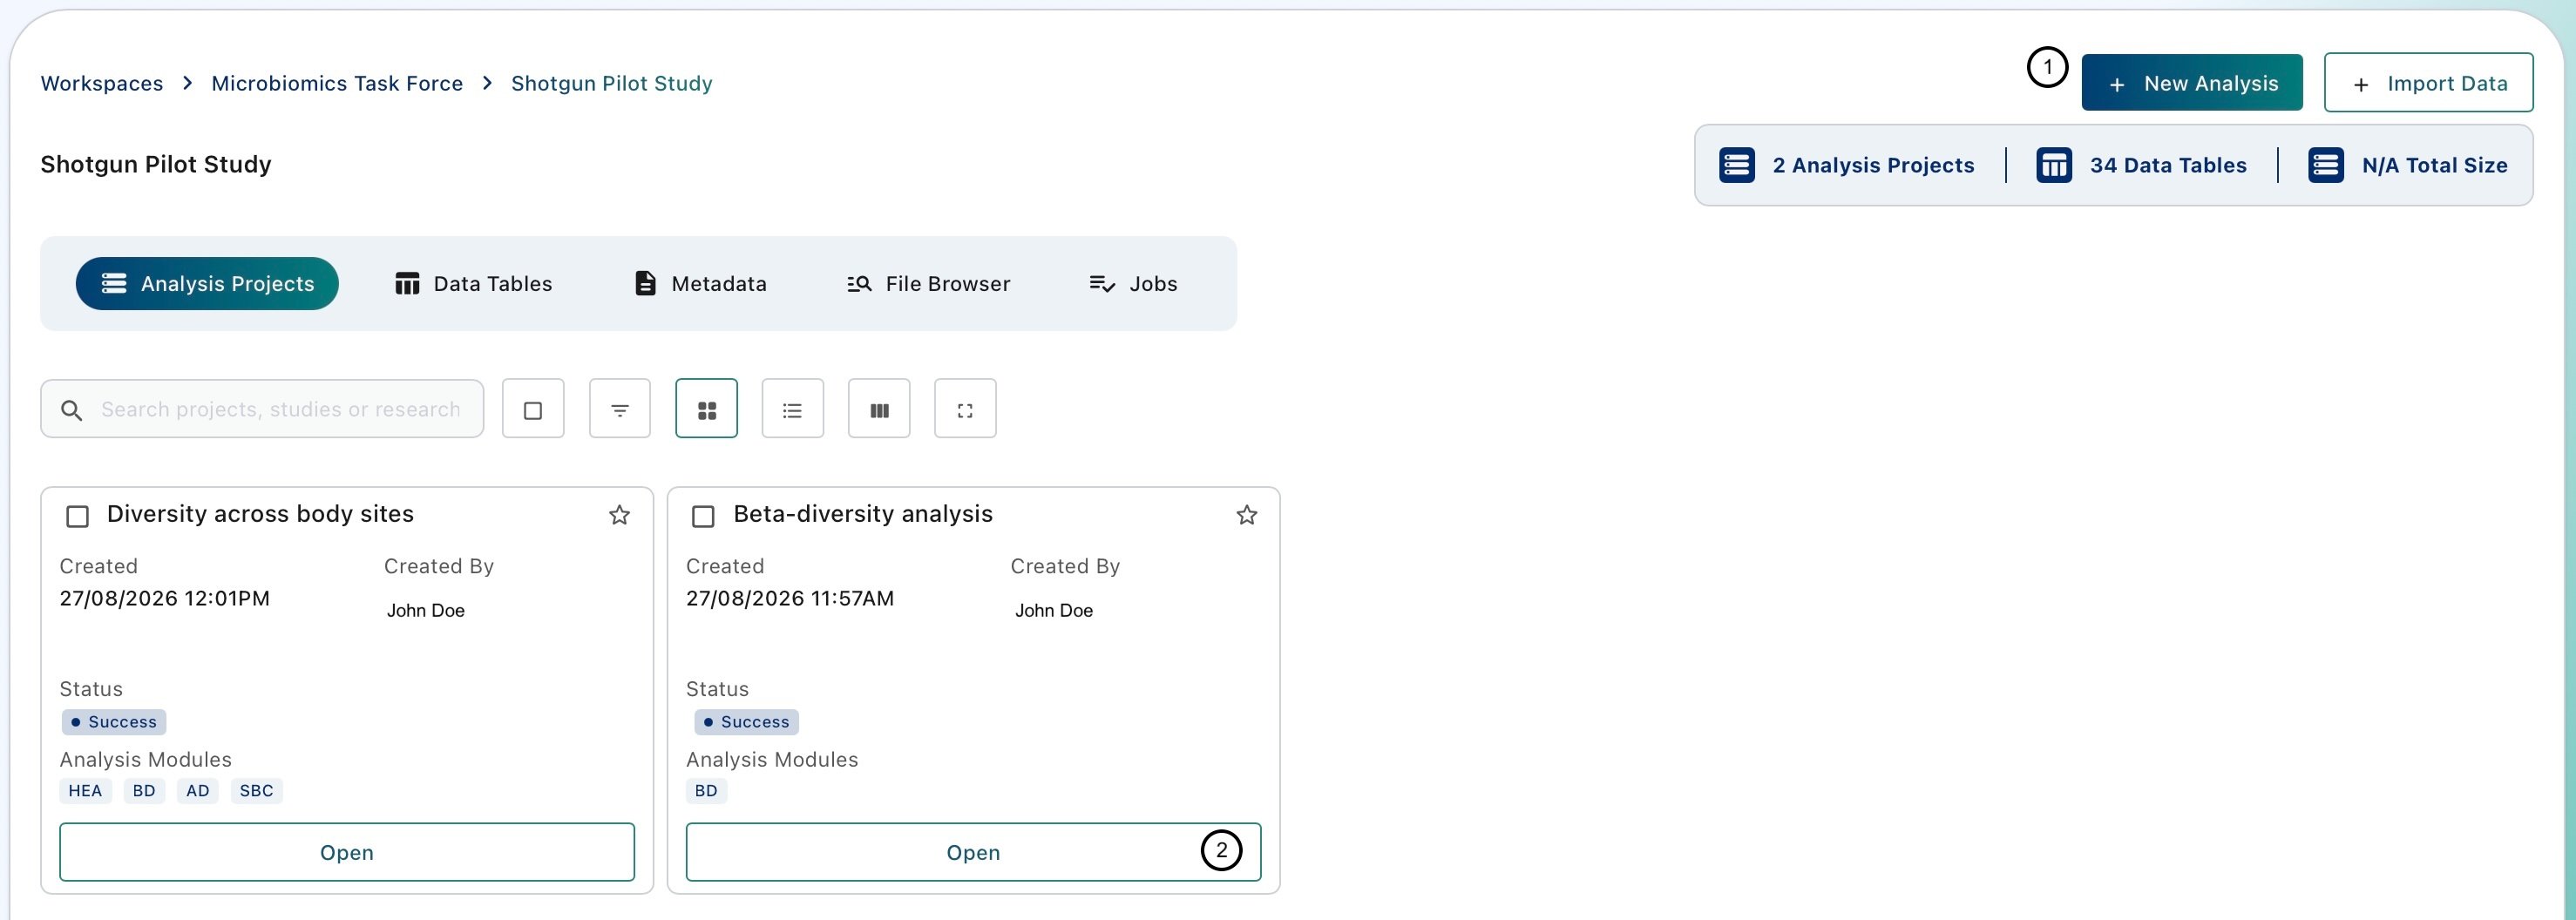 This section lists all Analysis Projects (AP) that have been created for the current study. Each Study (your research project) can hold any number of Analysis Projects, usually one for each relevant research question you want to answer with the data you have. Click **Open** to enter the Analysis Studio of an AP.
To learn more, visit [Analysis Projects (AP)](https://docs.cosmosid.com/DAP_docs/analysis-project-AP).
## Data Tables
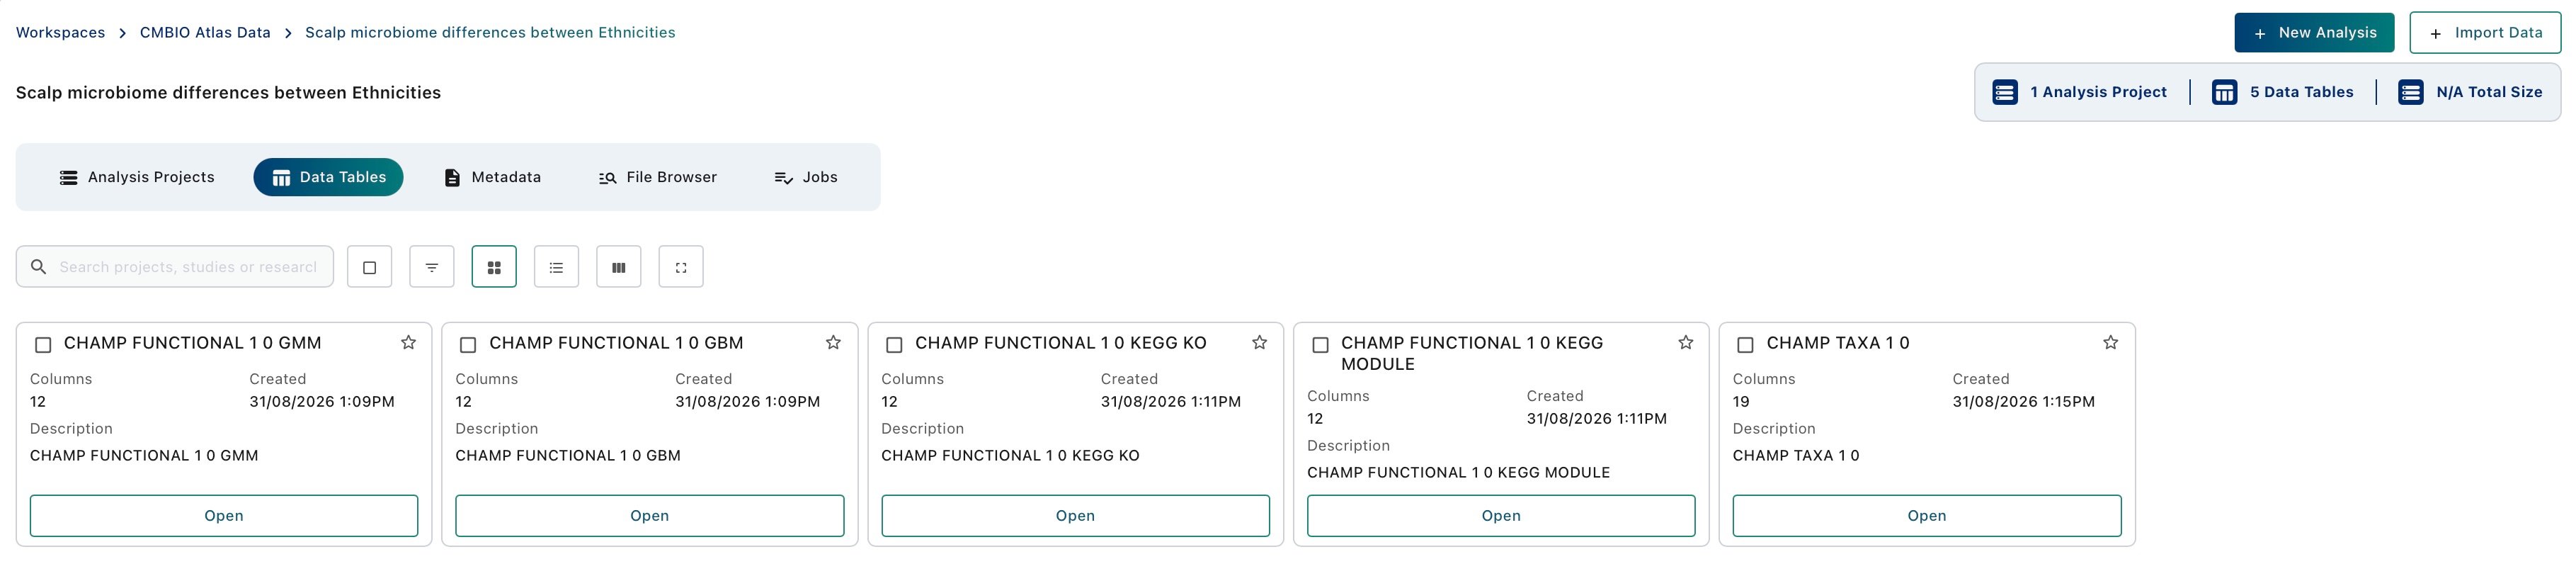
This section lists the Data Tables available in the current Study, including every Data Table imported into it. Each Study can hold any number of Data Tables.
This section lists all Analysis Projects (AP) that have been created for the current study. Each Study (your research project) can hold any number of Analysis Projects, usually one for each relevant research question you want to answer with the data you have. Click **Open** to enter the Analysis Studio of an AP.
To learn more, visit [Analysis Projects (AP)](https://docs.cosmosid.com/DAP_docs/analysis-project-AP).
## Data Tables
This section lists the Data Tables available in the current Study, including every Data Table imported into it. Each Study can hold any number of Data Tables.
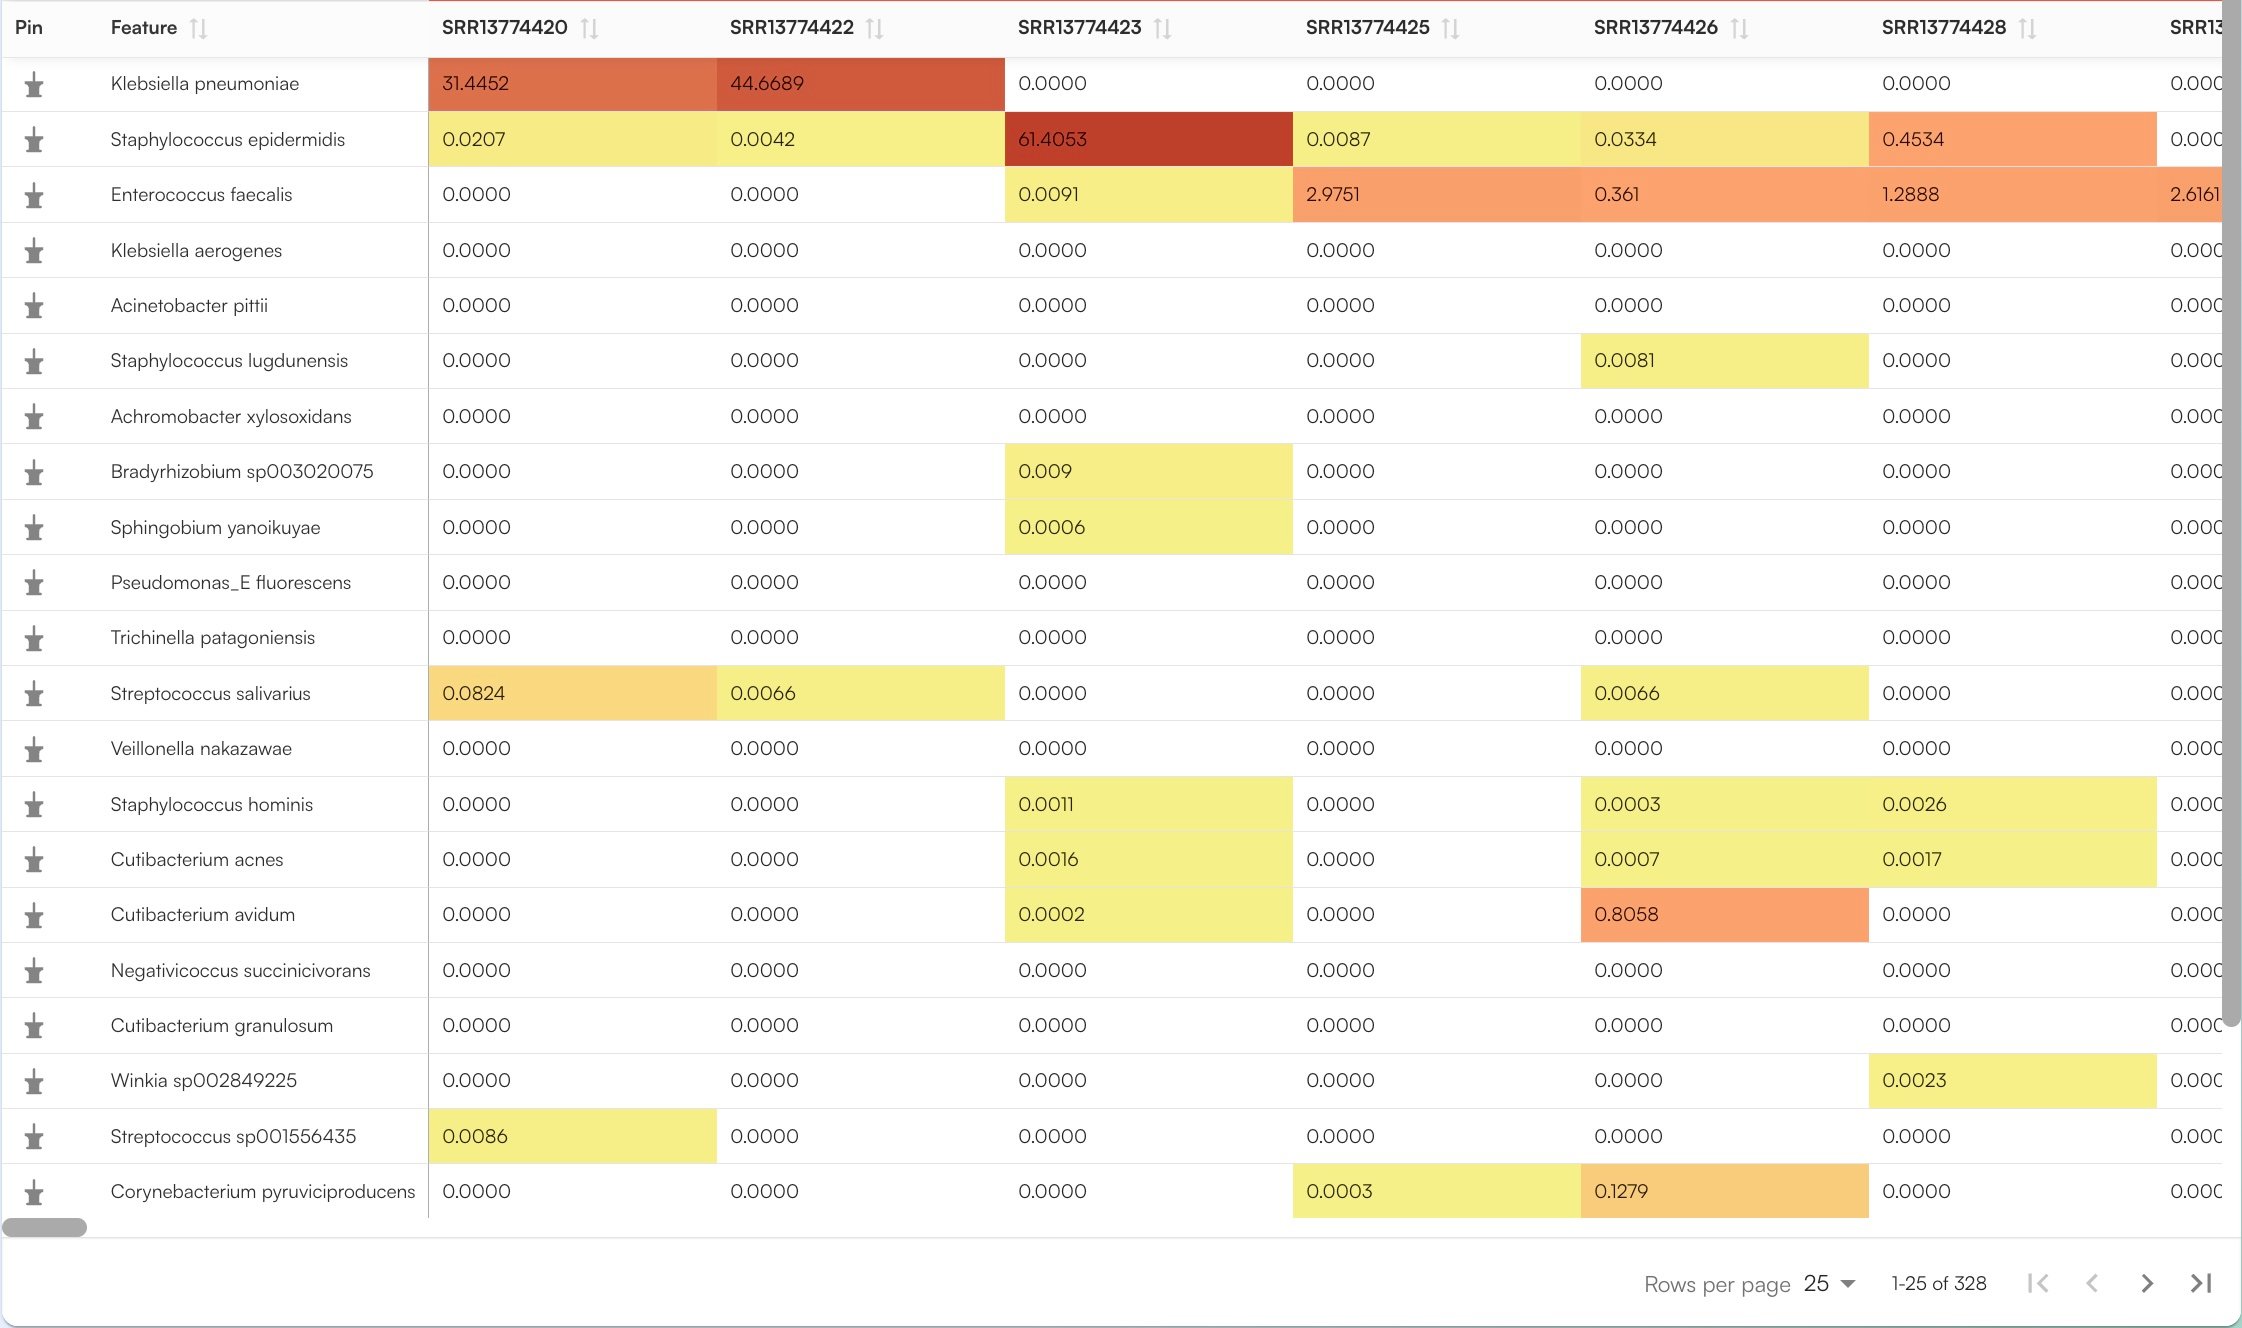
 A Data Table describes the feature profile of a set of microbiome samples, reporting the abundance of each feature in each sample.A feature is the biological unit quantified by the profile: a microbial species in a taxonomic profile, a GO term or enzyme class in a functional profile, or a metabolite in a metabolomics profile. You can picture it as a matrix with the samples along one side, the features along the other, and feature abundance values (e.g: relative abundances, counts, presence/absence) in the cells.
 . Data Tables imported into a Study are also added to the Workspace data lake, from which the Query Builder selects samples to build cohorts. (visit [Importing Data Into a Study](https://docs.cosmosid.com/DAP_docs/importing-data-in-studies))
## Metadata \[*in active development*]
. Data Tables imported into a Study are also added to the Workspace data lake, from which the Query Builder selects samples to build cohorts. (visit [Importing Data Into a Study](https://docs.cosmosid.com/DAP_docs/importing-data-in-studies))
## Metadata \[*in active development*]
 A metadata table holds the descriptive information about each sample in a Study. Each row is a sample and each column is a variable, such as the body site sampled, the subject’s age group or the collection site. The metadata table is mapped to the Data Tables through the sample IDs.
| Sample ID | Subject ID | Body site | Timepoint | Collection site |
| - | - | - | - | - |
| SRR13774420 | P01 | Gut | 1 | Site A |
| SRR13774422 | P01 | Gut | 2 | Site A |
| SRR13774423 | P02 | Skin | 1 | Site B |
| SRR13774426 | P03 | Skin | 1 | Site B |
Samples imported from a Cosmos-Hub account bring their sample metadata with them. The metadata is not displayed in the interface yet, but it is stored together with the imported samples.
## File Browser
The File Browser is the storage drive of the Study. Use it for project material that is not a Data Table, for example protocols, lab notes, raw sequencing files, supplementary files and Analysis Project outputs.
A metadata table holds the descriptive information about each sample in a Study. Each row is a sample and each column is a variable, such as the body site sampled, the subject’s age group or the collection site. The metadata table is mapped to the Data Tables through the sample IDs.
| Sample ID | Subject ID | Body site | Timepoint | Collection site |
| - | - | - | - | - |
| SRR13774420 | P01 | Gut | 1 | Site A |
| SRR13774422 | P01 | Gut | 2 | Site A |
| SRR13774423 | P02 | Skin | 1 | Site B |
| SRR13774426 | P03 | Skin | 1 | Site B |
Samples imported from a Cosmos-Hub account bring their sample metadata with them. The metadata is not displayed in the interface yet, but it is stored together with the imported samples.
## File Browser
The File Browser is the storage drive of the Study. Use it for project material that is not a Data Table, for example protocols, lab notes, raw sequencing files, supplementary files and Analysis Project outputs.
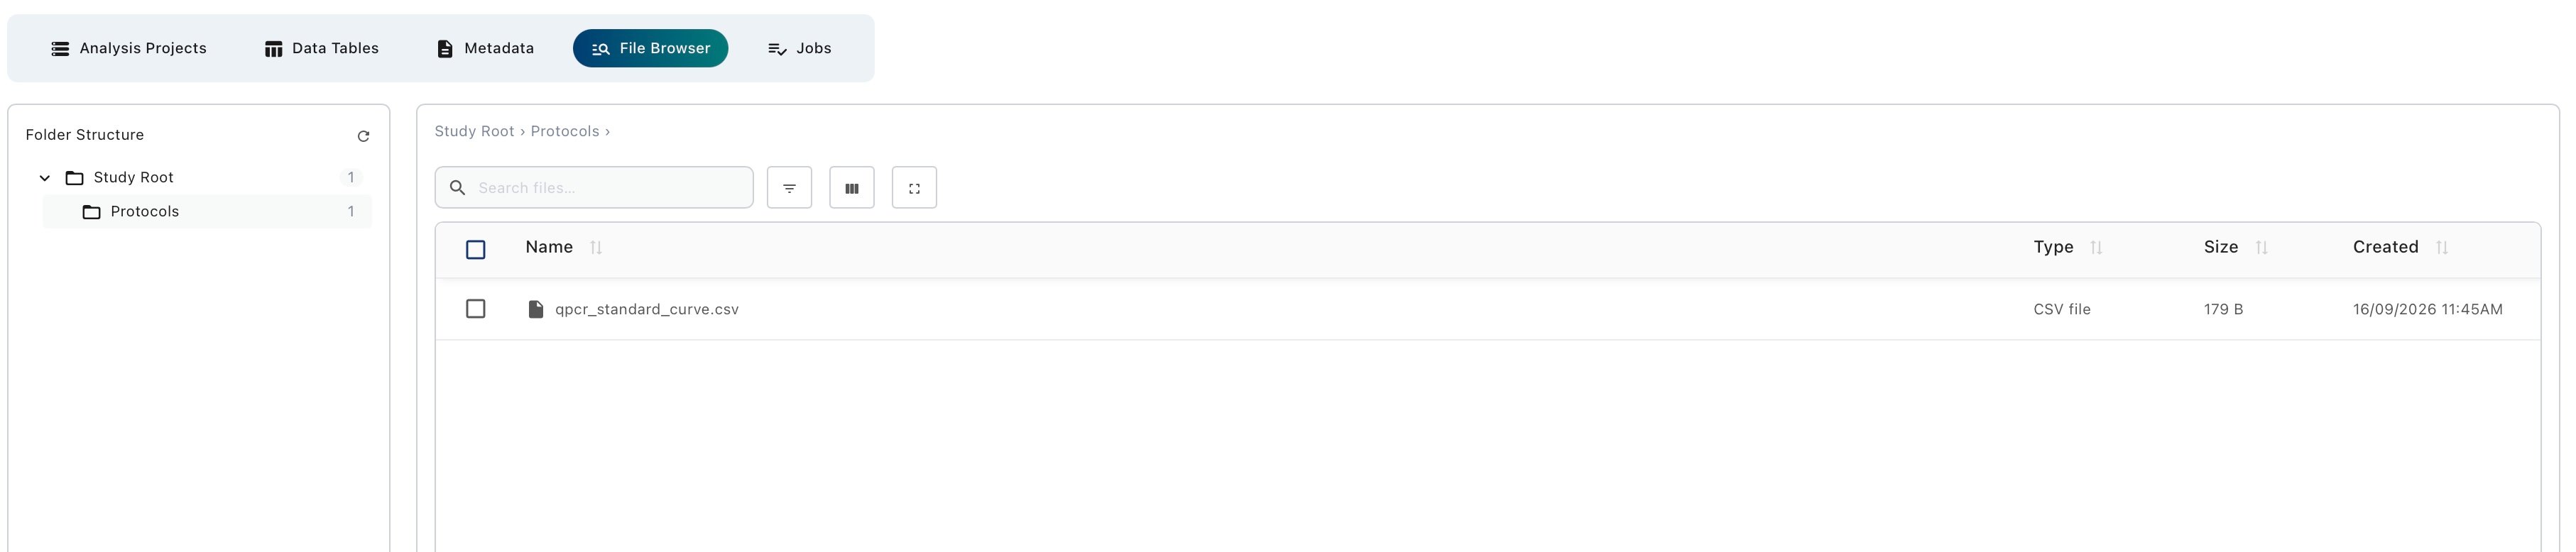 How to organise, upload and find files in a Study.
## Jobs
Data imports and Analysis Projects can take some time to complete. The Jobs section lists these operations and their progress, so you can check that an import has finished or that an analysis is ready before you open it.
How to organise, upload and find files in a Study.
## Jobs
Data imports and Analysis Projects can take some time to complete. The Jobs section lists these operations and their progress, so you can check that an import has finished or that an analysis is ready before you open it.
 Each row shows the job **Name**, its **Status**, a short **Details** message about the outcome, and the **Started** and **Last Updated** times. You can sort by any column or search for a job by name.
## Next step: bring in your data
The available import routes and how to use each one.
This documentation is built and hosted on [Mintlify](https://mintlify.com), a developer documentation platform.
Each row shows the job **Name**, its **Status**, a short **Details** message about the outcome, and the **Started** and **Last Updated** times. You can sort by any column or search for a job by name.
## Next step: bring in your data
The available import routes and how to use each one.
This documentation is built and hosted on [Mintlify](https://mintlify.com), a developer documentation platform.