

What is the Analysis Studio?
The Analysis Studio is the Cosmos-Hub 2.0 suite of Analysis Modules, designed to help you explore and analyse the Cohort defined in an Analysis Project. It brings together a broad range of popular microbiome bioinformatics analyses as nine different Analysis Modules, including exploratory visualisations, alpha- and beta-diversity analysis, differential abundance testing, machine learning, and much more. Each Analysis module can be fine tuned interactively, to produce publication-ready figures and statistical testing using dedicated parameters interactively and see results update as parameters change.Accessing the Analysis Studio
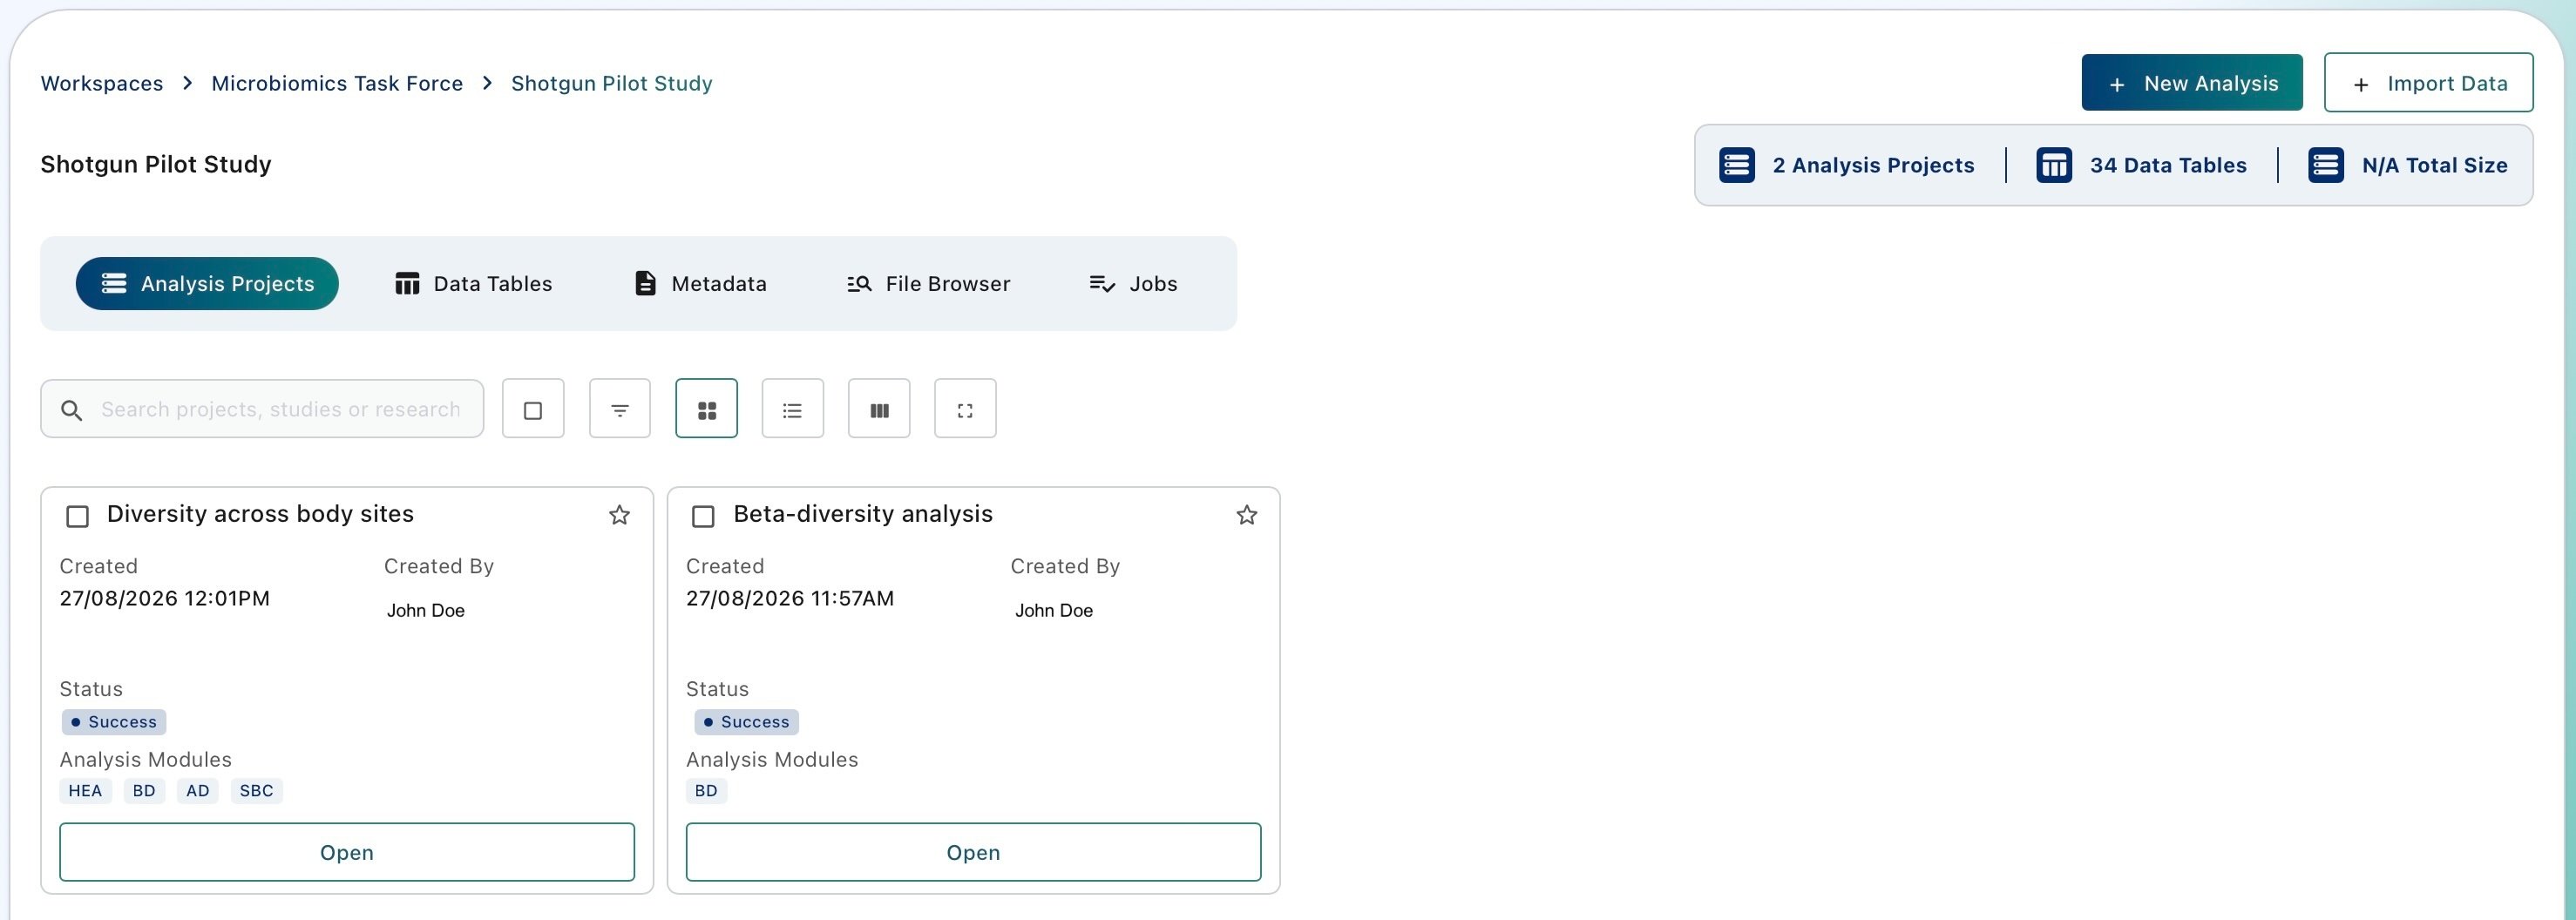
- To access the Analysis Studio, navigate the ‘Analysis Projects’ section of the Study Dashboard and enter an Analysis Project by clicking on the ‘Open’ of the corresponding card. This will open the Analysis Project Dashboard, listing all instances (Analysis Snapshots) of the Analysis Studio currently available for Analysis Project. Visit Analysis Snapshots for more details on what Analysis Snapshots are and how to use them.
- Click on ‘Open Current Analysis’ to enter the Analysis Studio for the current Analysis Project
A tour of the Analysis Studio
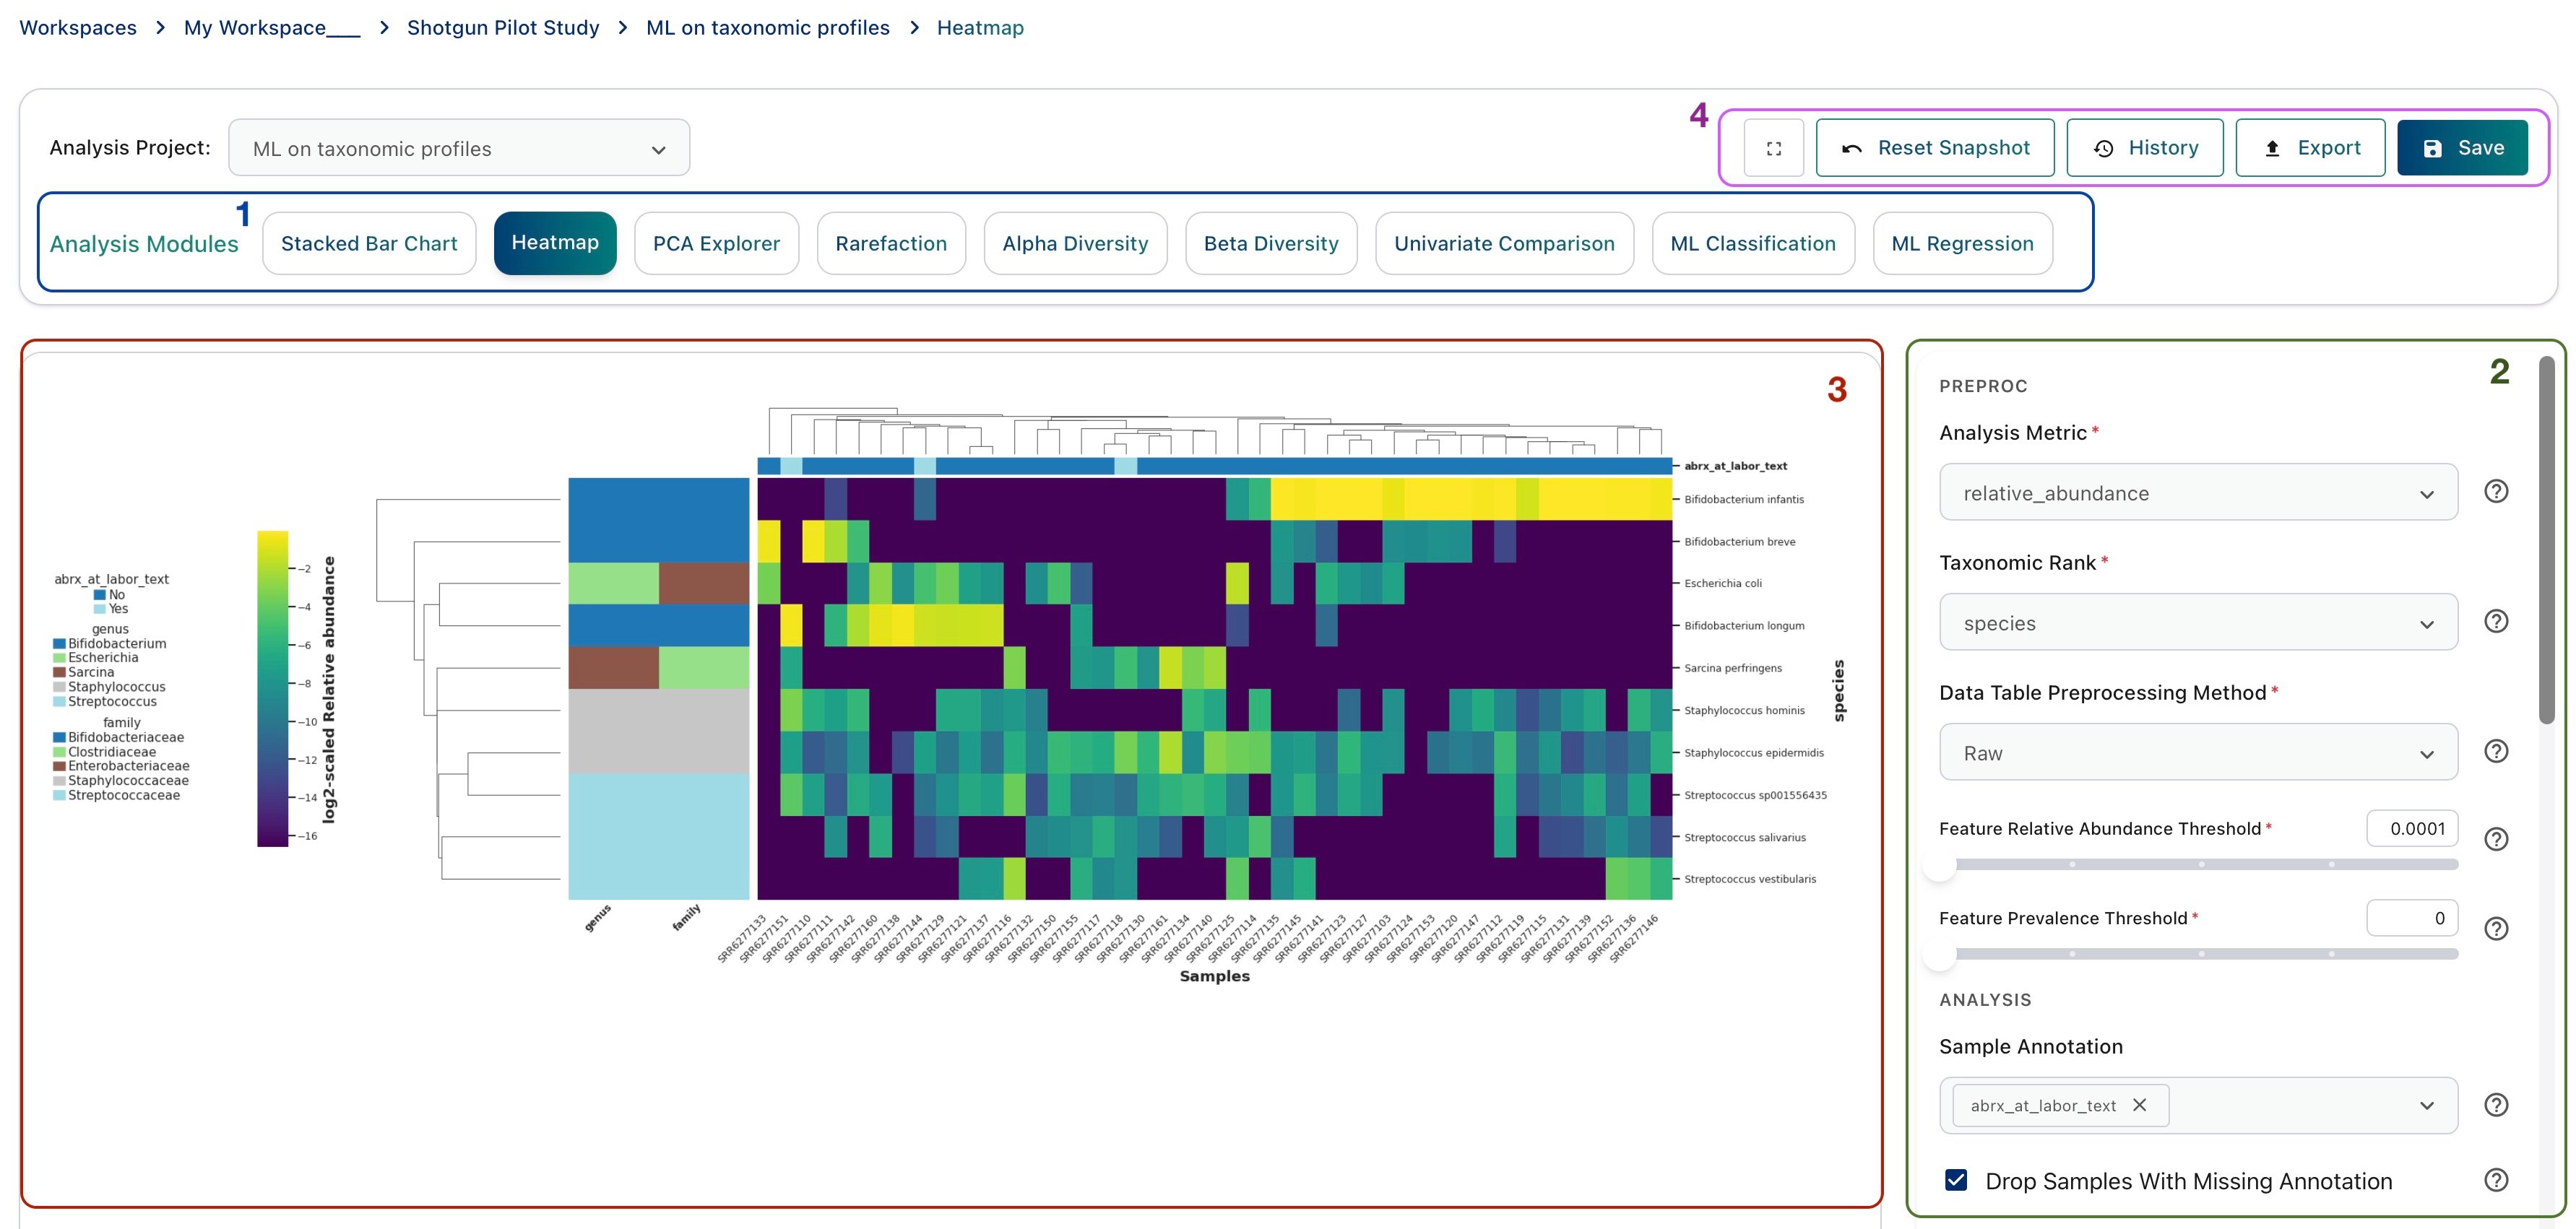
- The Analysis Modules panel: Choose an Analysis Module among those available to load the Analysis Module Parameter Panel.
Cosmos-Hub 2.0 includes nine analysis modules, each exploring your data in a different way. Select the one that fits your research question from the Module panel; each module’s overview is linked below. - The Analysis Module Parameter Panel: the panel the parameters Each Analysis Module is customisable, and require to set Pre-processing and Analysis parameters.
- Analysis Output Viewer: an embedded viewer (iFrame) that inetractively renders the figures, statistics, and tables the module produces for the set of parameters chose.
- Analysis Snapshots and Export control: allows to download the current Analysis Studio output, save the current instance of the Analysis Studio, and control Analysis Snapshots.
Running Analysis Modules
1
Select a module from the Analysis Modules Panel
If you any module is not available for your Analysis Project, you might not have selected it during Cohort and Analysis Project creation. Visit Create a Cohort with Query Builder to learn more.
Stacked Bar Chart
Heatmap
PCA Explorer
Rarefaction
Alpha Diversity
Beta Diversity
Univariate Comparison
ML Classification
ML Regression
2
Adjust Pre-processing and Module parameters
Each Analysis module requires to set the parameters for the module. The Analysis Module Parameter Panel is divided into two sections: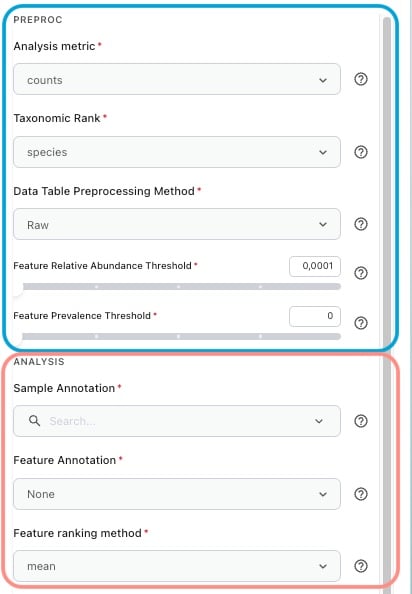
- PREPROC: this section includes parameters controlling data table pre-processing, i.e filtering samples or features from the data table before downstream analyis. Depending on the type of data currently available for the AP cohort, available parameter options might change. Learn more about Data table Pre-processing at Pre-processing Overview.
- Analysis: this section includes all Analysis Module-specific parameters. Analysis parameters control how that particular analysis is run and displayed. To learn more on how to tune Analysis Modules and how to read their outputs, visit the guides available in the documentation (e.g: Heatmap on Cosmos-Hub 2.0)
3
Run the Analysis Module

4
Read the Analysis Module output
Once the Analysis module finishes running, figures and tables will appear on the Analysis Output Viewer.
Download the output of an Analysis Module
Click the Export button in the Analysis Snapshots and Export control menu to download all the figures and table generated by the current Analysis Module:- Figures
- Statistical tables
- A record of the analysis parameter used
- The raw and pre-processed input data table
- The raw and pre-processed metadata
Sometimes, when switching between modules, the output view or the parameter panel fails to load, and the center of the screen keeps showing a spinning ‘Loading module…’ circle. Reloading the output view fixes this; your parameters and saved snapshots are not affected.
- On the bottom-right of the Analysis Module interface, open the Current Configuration dropdown.

- It shows information about the selected module, with a grey box listing the current parameters in JSON format. While the output view is stuck on ‘Loading module…’, this box is empty.
- Click Reload iFrame to refresh the output view and the parameter panel.
Saving a Snapshot of your Analysis
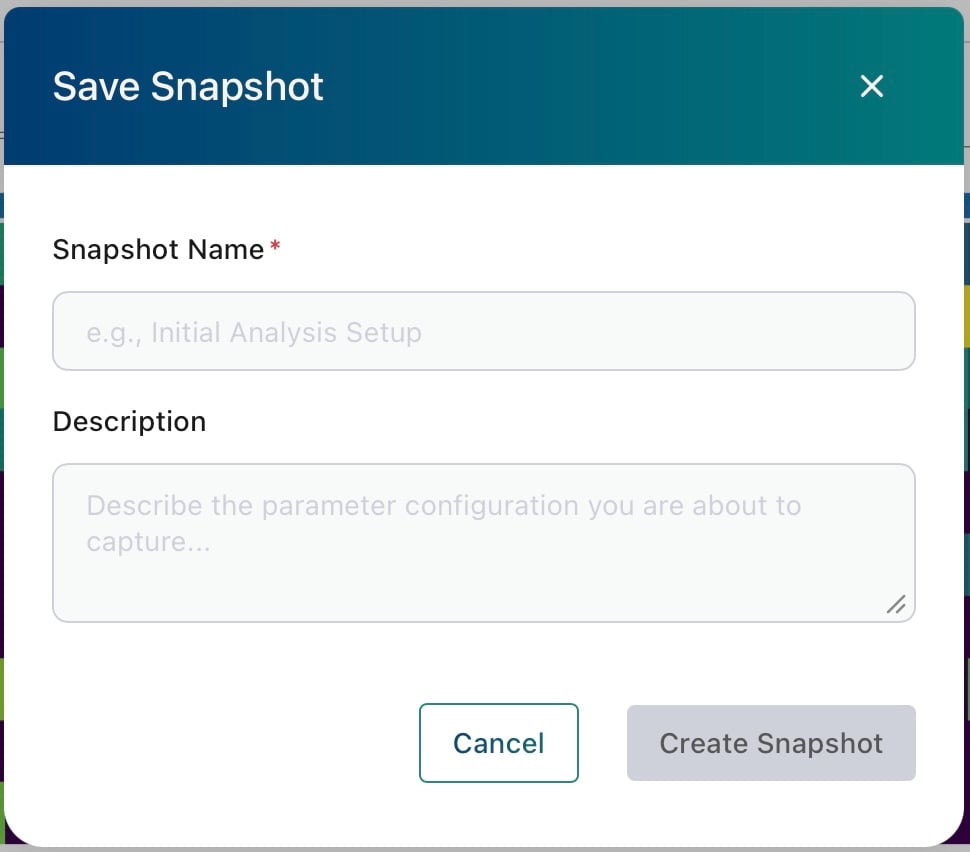
Analysis Modules can include several parameters, which can make it difficult to reproduce a specific output from memory alone. In Cosmos-Hub 2.0, you can save an Analysis Snapshot of the current Analysis Studio state, preserving the configuration that generated a given figure. Anyone with access to the current workspace can open the snapshot, review the same output and parameter settings, and continue the analysis from that point by adjusting the configuration further. To save a Snapshot of your Analysis:- Click on the ‘Save’ button, in the Analysis Snapshots and Export control menu.
- Choose a name and a description (optional) for the Analysis Snapshot
FAQ
How do I download the feature table used in my analysis?
How do I download the feature table used in my analysis?
You can download both the original feature table (taxonomic or functional profiles) and the pre-processed version used by the current Analysis Module, together with the matching metadata.
1
Run any Analysis Module
Select any module from the Analysis Modules Panel (e.g. Stacked Bar Chart).
2
Set the pre-processing parameters
In the PREPROC section of the Analysis Module Parameter Panel, set the pre-processing parameters you want to apply to the feature table (e.g. analysis metric, taxonomic rank, abundance and prevalence thresholds).
3
Click Run and Apply
Click Run and Apply so the pre-processing is applied to the feature table.
4
Click Export
Click the Export button in the Analysis Snapshots and Export control menu. This downloads a folder that includes:
- the **raw feature table **, before pre-processing -
input_features.csv - the pre-processed feature table, as used by the module (e.g. relative abundances aggregated at genus level) -
transformed_features.csv - the **raw and pre-processed metadata - **
input_metadata.csvandtransformed_metadata.csv