Comparative Analysis and Statistics
Abundance Distribution
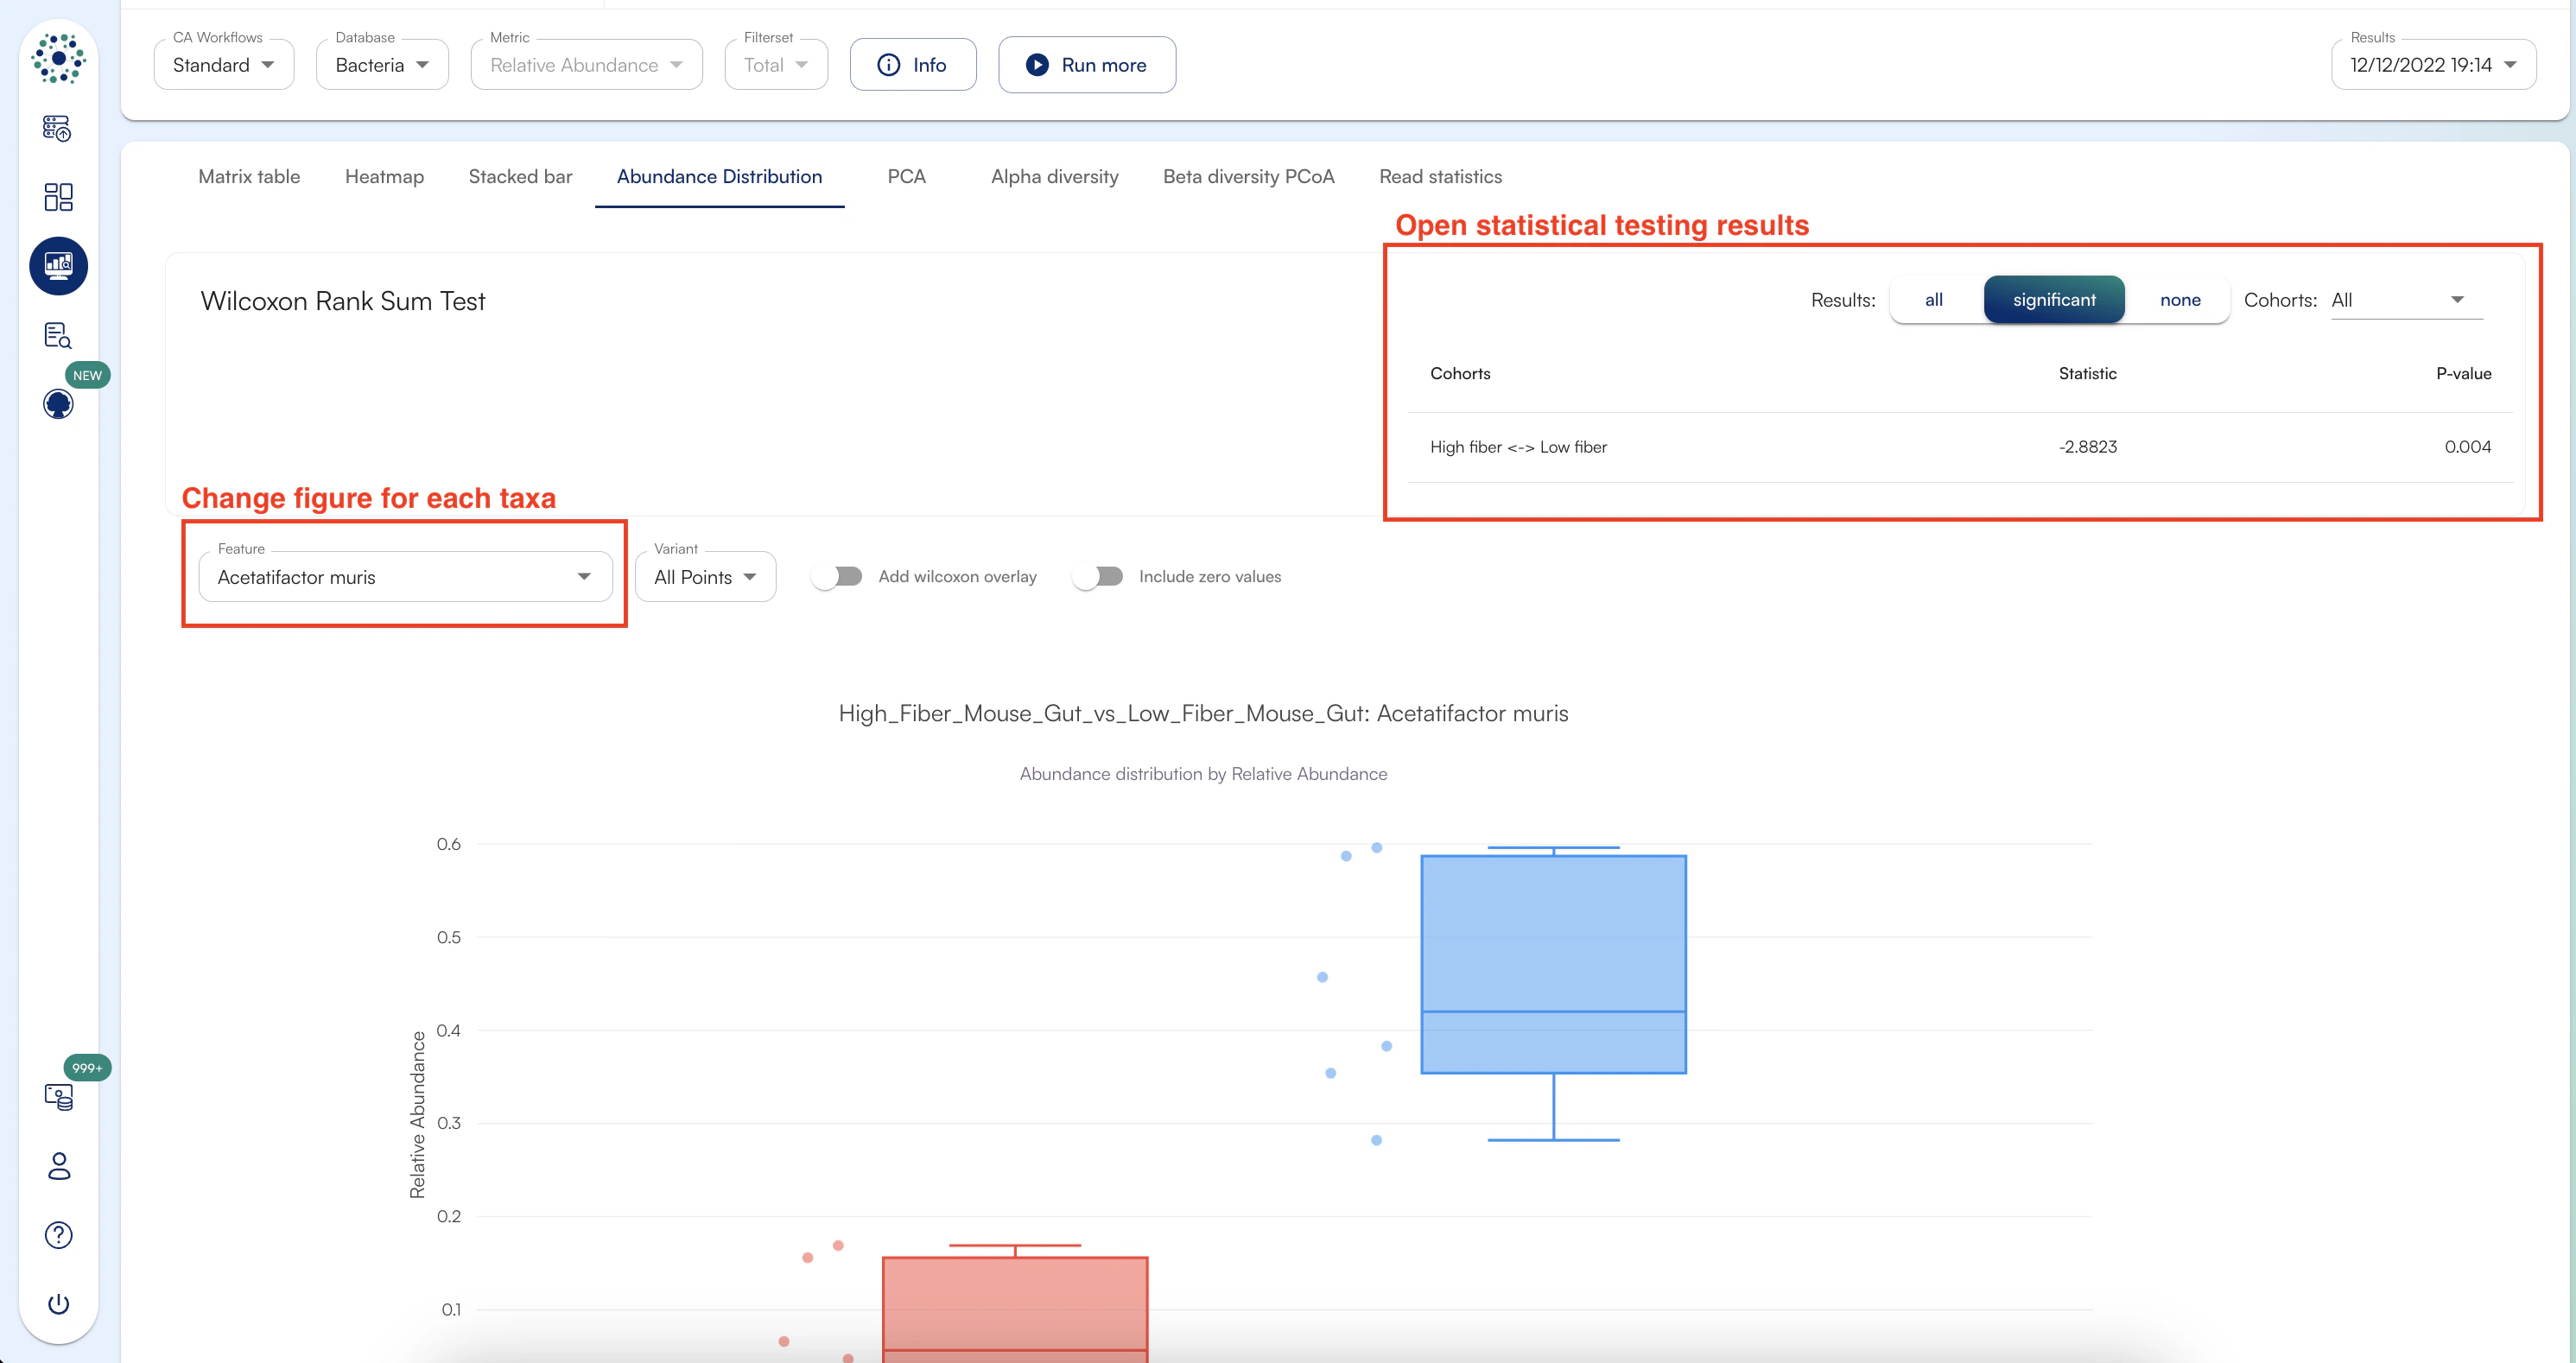
Abundance Distribution module allows you to visualize the distribution of individual taxa/features using boxplot across your chosen cohorts.
For taxonomic results, any features from any taxonomic levels can be visualized as well by selecting the desired level from the top bar. The video below demonstrates the different functionalities of abundance distribution module.
Abundance Distribution module also allows you to do wilcoxon rank sum test to discern if the difference in abundance distribution is significant or not. The Wilcoxon rank sum test can be overlayed on the boxplot using wilcoxon overlay toggle button.
Previous
PCAPrincipal Component Analysis (PCA) is used to visually explore complex data in a way that makes it easier to emphasize variation to bring out strong patterns.
Next