Matrix table overview
A matrix table displays the data that is used for comparative analysis. It displays all of the selected samples across the first row of a spreadsheet and all of the organisms or genes (in the case of antibiotic resistance or virulence factors) down the first column. If labels were used when creating the comparative analysis, the samples are organized by label. For each sample you can see the presence or absence of organisms present and the value that was chosen when creating the comparative analysis (relative abundance, frequency, total matches % or unique matches %). For any given organism you can see which samples it is present in. This table is useful as it contains data for all of your samples in one table and it can be used for many analyses including heat maps, PCA, and other comparative visualizations.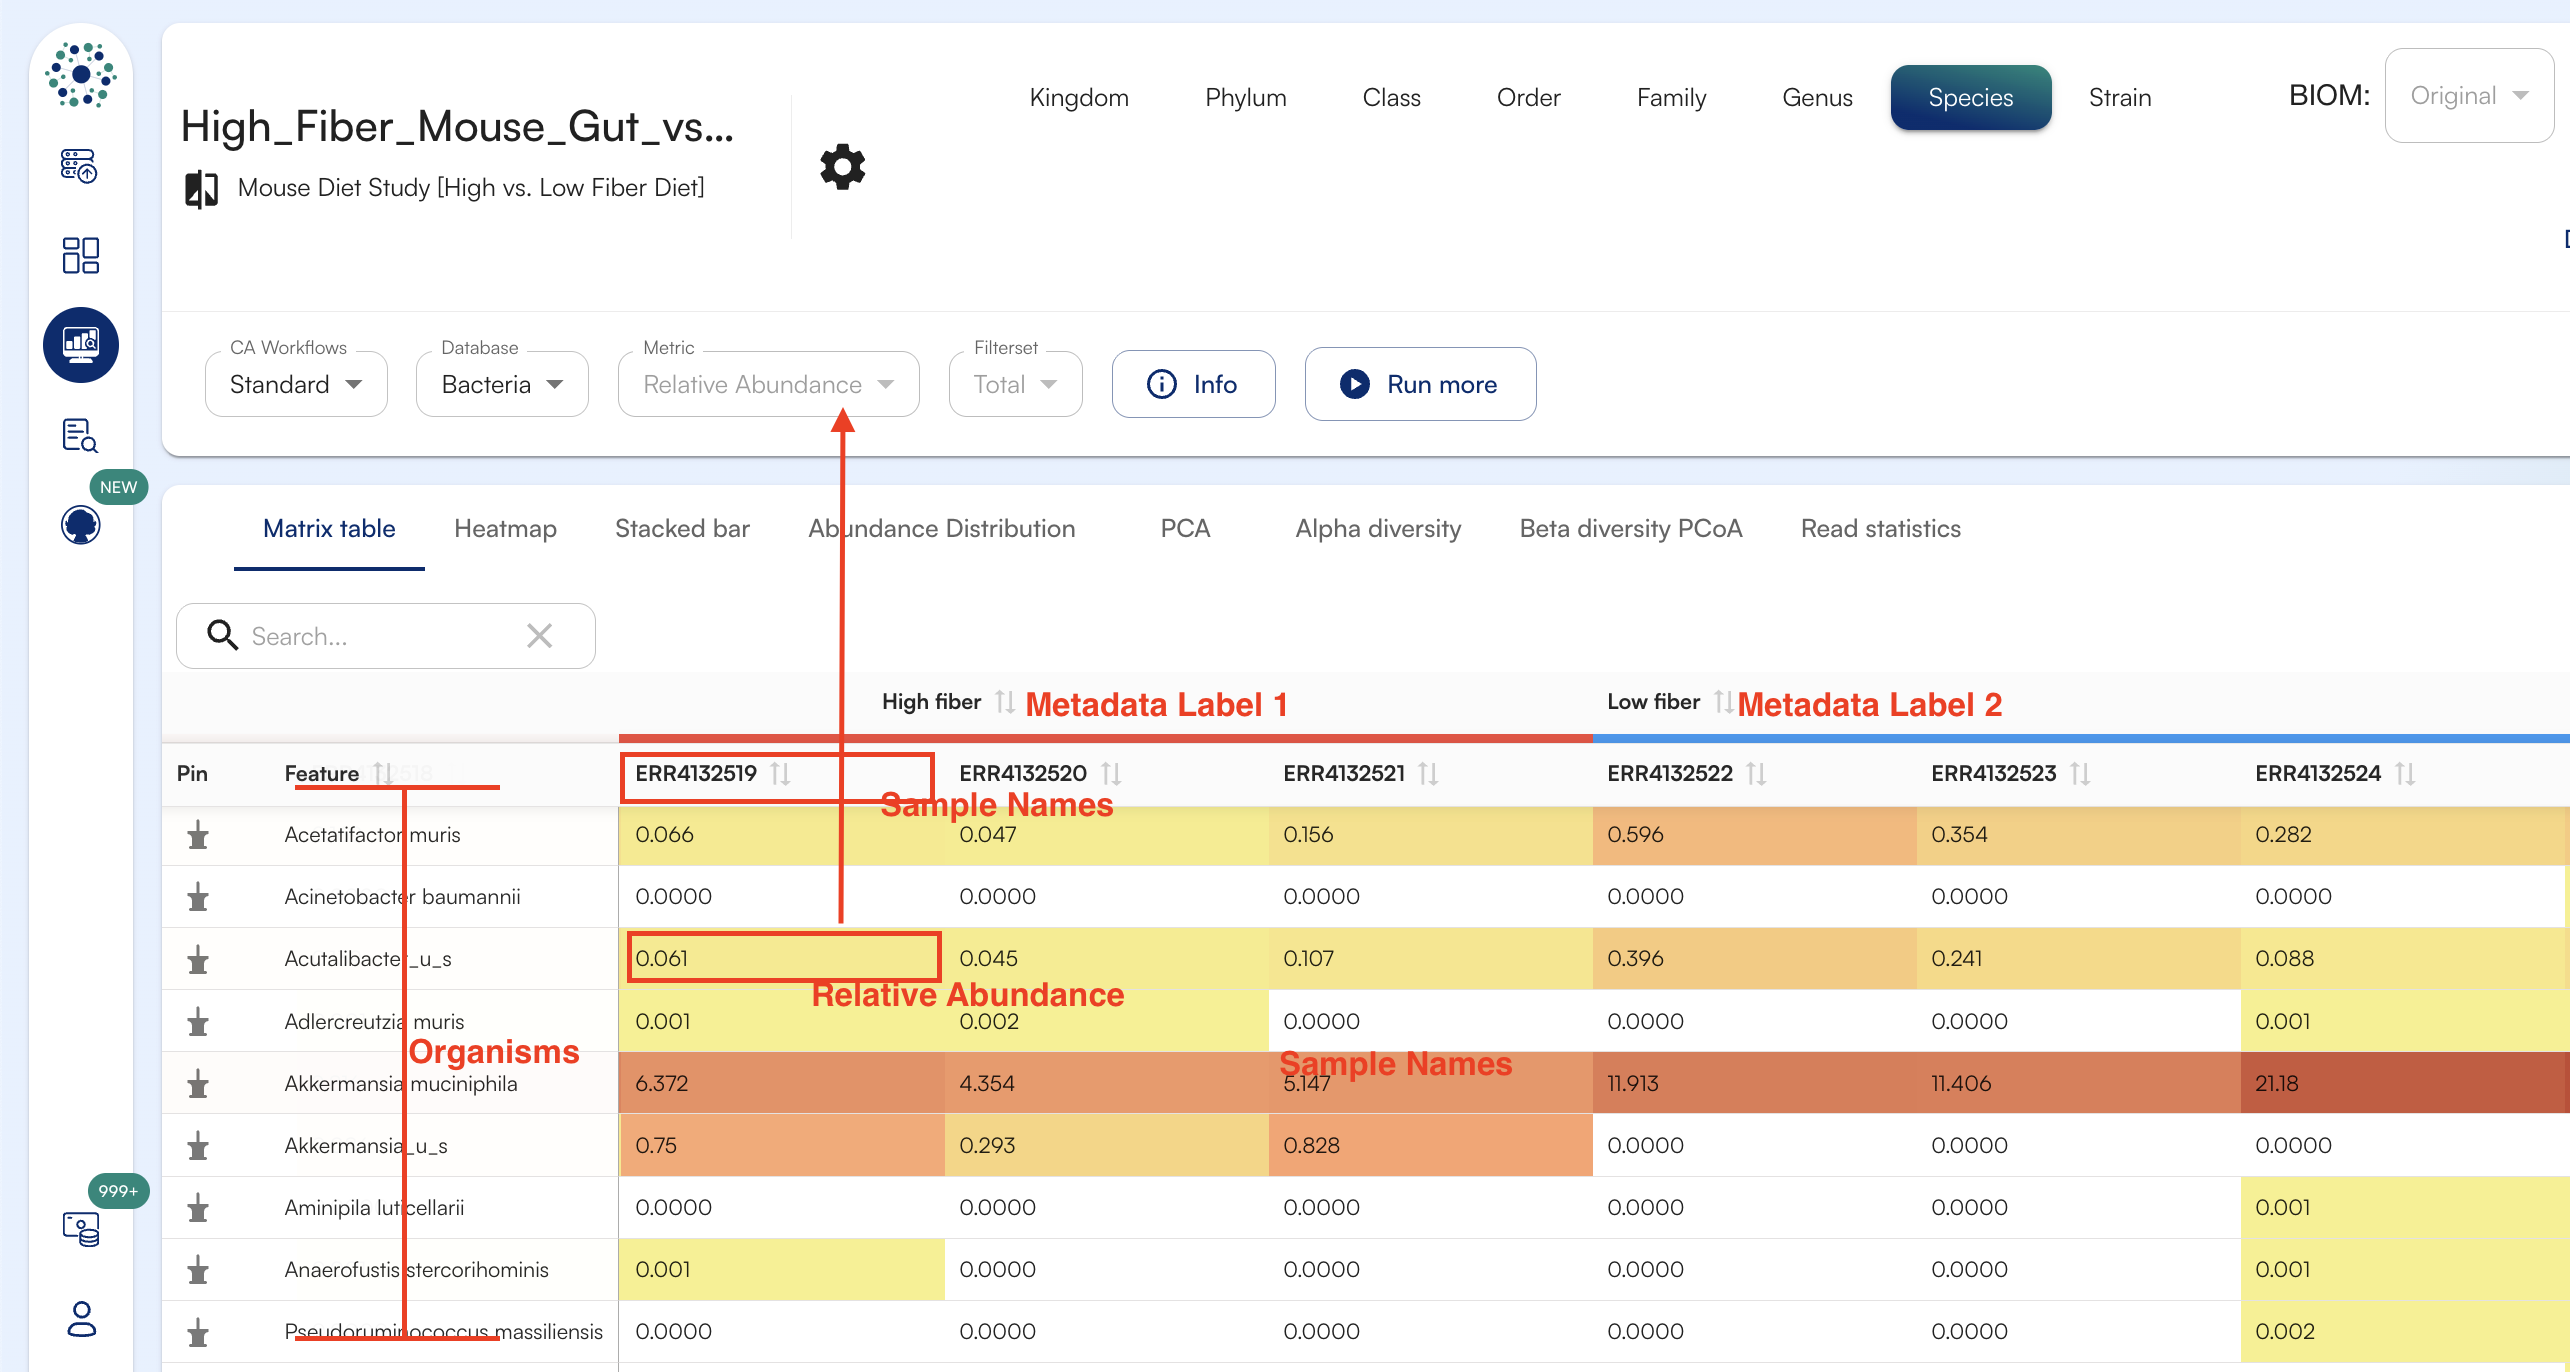
Sorting the matrix
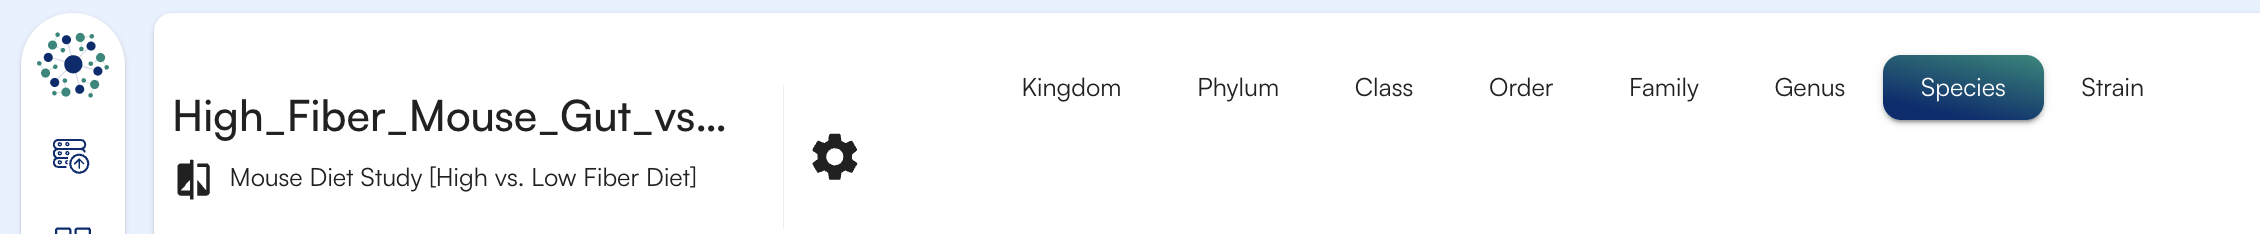
You can sort the matrix by clicking on a sample name, search the matrix, download as a TSV file, or change taxonomic levels.Downloading the matrix
You can download this matrix and use it for your own analyses as well. To download the matrix, when you are viewing it, click “Export” in the upper right corner and select “TSV”.Other Buttons and Navigation
Logscale: Sometimes it is difficult to discriminate low abundance calls if you have some results that are at a very low abundance and some that are high abundance. In order to better distinguish between low abundance calls, we provide an option to view the log scale version of your data. To view or download the log base 2 version of your matrix you can do so by selecting “Yes” next to Logscale in the upper menu bar.