What is alpha diversity and how is it calculated?
It’s crucial for understanding how diverse or rich your microbiome sample is in terms of different microorganisms. When talking about alpha diversity, we are looking at two things:
- Species richness - a count of the number of different species present in a sample. It does not take into account the abundance of the species or their relative distributions.
- Species evenness - a measure of relative abundance of different species that make up the richness.
The input metric for Alpha Diversity is Normalized Reads Frequency, which is the genome-normalized number of reads that reflects the underlying microbiome composition of the community. The aggregation level of the input data for Comparative Analysis has been set to species level.
Metrics for Alpha Diversity
CHAO1 Index
Shannon Index
Simpson Index
Citation: Chao, A. (1987). “Estimating the population size for capture-recapture data with unequal catchability.” Biometrics 43(4): 783–791.The CHAO1 Index is an estimator of species richness that estimates the true number of species in a community based on the abundance pattern of rare species in your sample. Unlike simple species counts, CHAO1 accounts for species that are likely present but were not detected due to insufficient sampling depth.How CHAO1 WorksCHAO1 operates on the capture-recapture principle and specifically uses Singletons (f₁, species observed exactly once in the sample) and Doubletons (f₂, species observed exactly twice in the sample).The estimator assumes that if many species are observed only once or twice, there are likely additional species present that were not captured at all. The more singletons relative to doubletons, the higher the estimated number of unobserved species.The CHAO1 estimate is calculated as CHAO1 = S_observed + (f₁²)/(2 × f₂)Where: S_observed = number of species actually observed in the sample, f₁= number of species represented by exactly one read (singletons), and f₂ = number of species represented by exactly two reads (doubletons).Why CHAO1 is Valuable for Microbiome Data
CHAO1 is particularly useful for microbiome datasets because sequencing often undersamples rare species due to sequencing depth limitations. Many microbiome samples contain a number of low-abundance species, and CHAO1 provides a more accurate estimate of true community diversity than observed richness alone. It also helps compare samples with different sequencing depths.This estimator does not assume any particular statistical distribution for the total number of organisms in the sample, but rather relies on the empirical pattern of rare species detection to infer total richness. Citation: Shannon, C. E. (1948). “A mathematical theory of communication.” Bell System Technical Journal, 27, 379–423 & 623–656.)The Shannon Diversity Index (also known as Shannon-Weaver Index or Shannon Entropy) is a measure that quantifies both the richness (total number of different species present) and evenness (how equally abundant the different species are) of species in a community. Unlike simple richness measures that only count the number of different species, the Shannon Index considers how abundance is distributed among those species.How the Shannon Index Works
The Shannon Index is rooted in information theory and measures the amount of “uncertainty” or “surprise” in predicting the species identity of a randomly selected individual from the community. Higher uncertainty indicates higher diversity.Mathematical FormulaThe Shannon Index is calculated as: H’ = -Σ(pi × ln(pi))Where: H’ = Shannon diversity index, pi = proportion of individuals belonging to species i (pi = ni/N, where ni = number of individuals of species i, N = total number of individuals in the sample), ln = natural logarithm, and Σ = sum across all species.Understanding the Scale
Minimum value (0): Occurs when only one species is present (no diversity)
Maximum value: Increases with both the number of species and evenness of their distribution
Typical range: Most microbiome samples fall between 1-4, with higher values indicating greater diversity
Practical Example
Consider two microbial communities with 4 species each:Community A (Low evenness):Species 1: 97 individualsSpecies 2: 1 individualSpecies 3: 1 individualSpecies 4: 1 individualShannon Index ≈ 0.24Community B (High evenness):Species 1: 25 individualsSpecies 2: 25 individualsSpecies 3: 25 individualsSpecies 4: 25 individualsShannon Index ≈ 1.39Both have the same richness (4 species), but Community B has much higher diversity due to evenness.Why Shannon Index is Valuable for Microbiome Analysis
Shannon Index captures both richness and evenness in a single metric and is sensitive to rare species. This means it accounts for low-abundance taxa that might be ecologically important. This index is also widely comparable across studies and ecosystems and robust to sampling differences when calculated from relative abundances. The index is also ecologically meaningful as it relates to community stability and function.
Important Considerations
The Shannon Index calculates diversity based on the observed species and their relative abundances in your sample. It does not assume that all possible species are represented, nor does it require any specific sampling assumptions beyond the data you provide. The metric reflects the uncertainty in species identity when randomly selecting from the observed community composition. Citation: Simpson, E. H. (1949). “Measurement of diversity.” Nature, 163(4148), 688.The Simpson Diversity Index is a measure of community diversity that quantifies the probability that two individuals randomly selected from a sample belong to different species. Unlike the Shannon Index, which weighs all species more equally, Simpson’s Index is more sensitive to changes in the most abundant species, making it particularly useful for detecting dominance patterns in microbial communities.How the Simpson Index WorksThe Simpson Index measures dominance rather than diversity directly. It calculates the probability that two randomly chosen individuals from the same sample belong to the same species. The index is then often converted to express diversity rather than dominance.In a highly diverse community with even abundances, the probability of randomly selecting two individuals of the same species is low. In a community dominated by one or few species, this probability is high.Mathematical FormulationsSimpson’s Dominance Index (D): D = Σ(pi²), which is then converted to:Simpson’s Diversity Index (1-D): 1-D = 1 - Σ(pi²), which is the reported value.Where: pi = proportion of individuals belonging to species i (pi = ni/N, where ni = number of individuals of species i, and N = total number of individuals in the sample), Σ = sum across all speciesUnderstanding the Numerical Meaning:
Simpson’s Diversity (1-D) ranges from 0 to 1, with higher values = greater diversity. 0 = no diversity, 1 = maximum possible diversity.High Simpson diversity often correlates with community stability. Low Simpson diversity may indicate disturbance or selective pressures. Useful for tracking recovery after perturbations (e.g., antibiotics)Practical Example
Consider two microbial communities with identical richness (4 species, 100 individuals each):Community A (High dominance):Species 1: 94 individuals (p₁ = 0.94)Species 2: 2 individuals (p₂ = 0.02)Species 3: 2 individuals (p₃ = 0.02)Species 4: 2 individuals (p₄ = 0.02)D = (0.94)² + (0.02)² + (0.02)² + (0.02)² = 0.8851-D = 0.115 (low diversity)Community B (Low dominance):Species 1: 25 individuals (p₁ = 0.25)Species 2: 25 individuals (p₂ = 0.25)Species 3: 25 individuals (p₃ = 0.25)Species 4: 25 individuals (p₄ = 0.25)D = 4 × (0.25)² = 0.251-D = 0.75 (high diversity)Key Characteristics for Microbiome AnalysisThe Simpson Index (1-D) is sensitive to abundant species, meaning that small changes in dominant species abundances significantly affect Simpson values. It is less sensitive to rare species compared to Shannon Index and is excellent for detecting shifts in community dominance structure. This index is also less affected by sequencing depth variations than richness-based metrics and stable across different sampling efforts when calculated from relative abundances.Important ConsiderationsThe Simpson Index reflects the dominance structure of the observed community based on relative abundances. It does not make assumptions about unobserved species or require specific sampling models. The metric directly quantifies the probability-based concept of diversity within your sample’s observed composition. Alpha Diversity Statistics: Wilcoxon rank-sum test
How does this test work and what do the results mean?This non-parametric statistical test investigates whether two independent cohorts have significantly different alpha diversity distributions. The null hypothesis is that a randomly selected value from one cohort has an equal chance of being greater or less than a value from another cohort.P-values below 0.05 indicate a significant difference, meaning the cohorts have distinct alpha diversity distributions. A negative test statistic indicates that Cohort 1 has a lower median alpha diversity compared to Cohort 2, while a positive statistic indicates the opposite.Viewing the Test ResultsAbove the alpha diversity charts, the Result Switcher allows viewing results for “ALL” cohorts or only those with “SIGNIFICANT” differences (p<0.05). The default is “NONE.”The Cohort Menu offers additional filtering, enabling selection of specific cohort combinations to display test statistics and p-values. Results can be exported as TSV.Statistical P-values can also be visualized on the boxplot by turning on the add wilcoxon overlay toggle
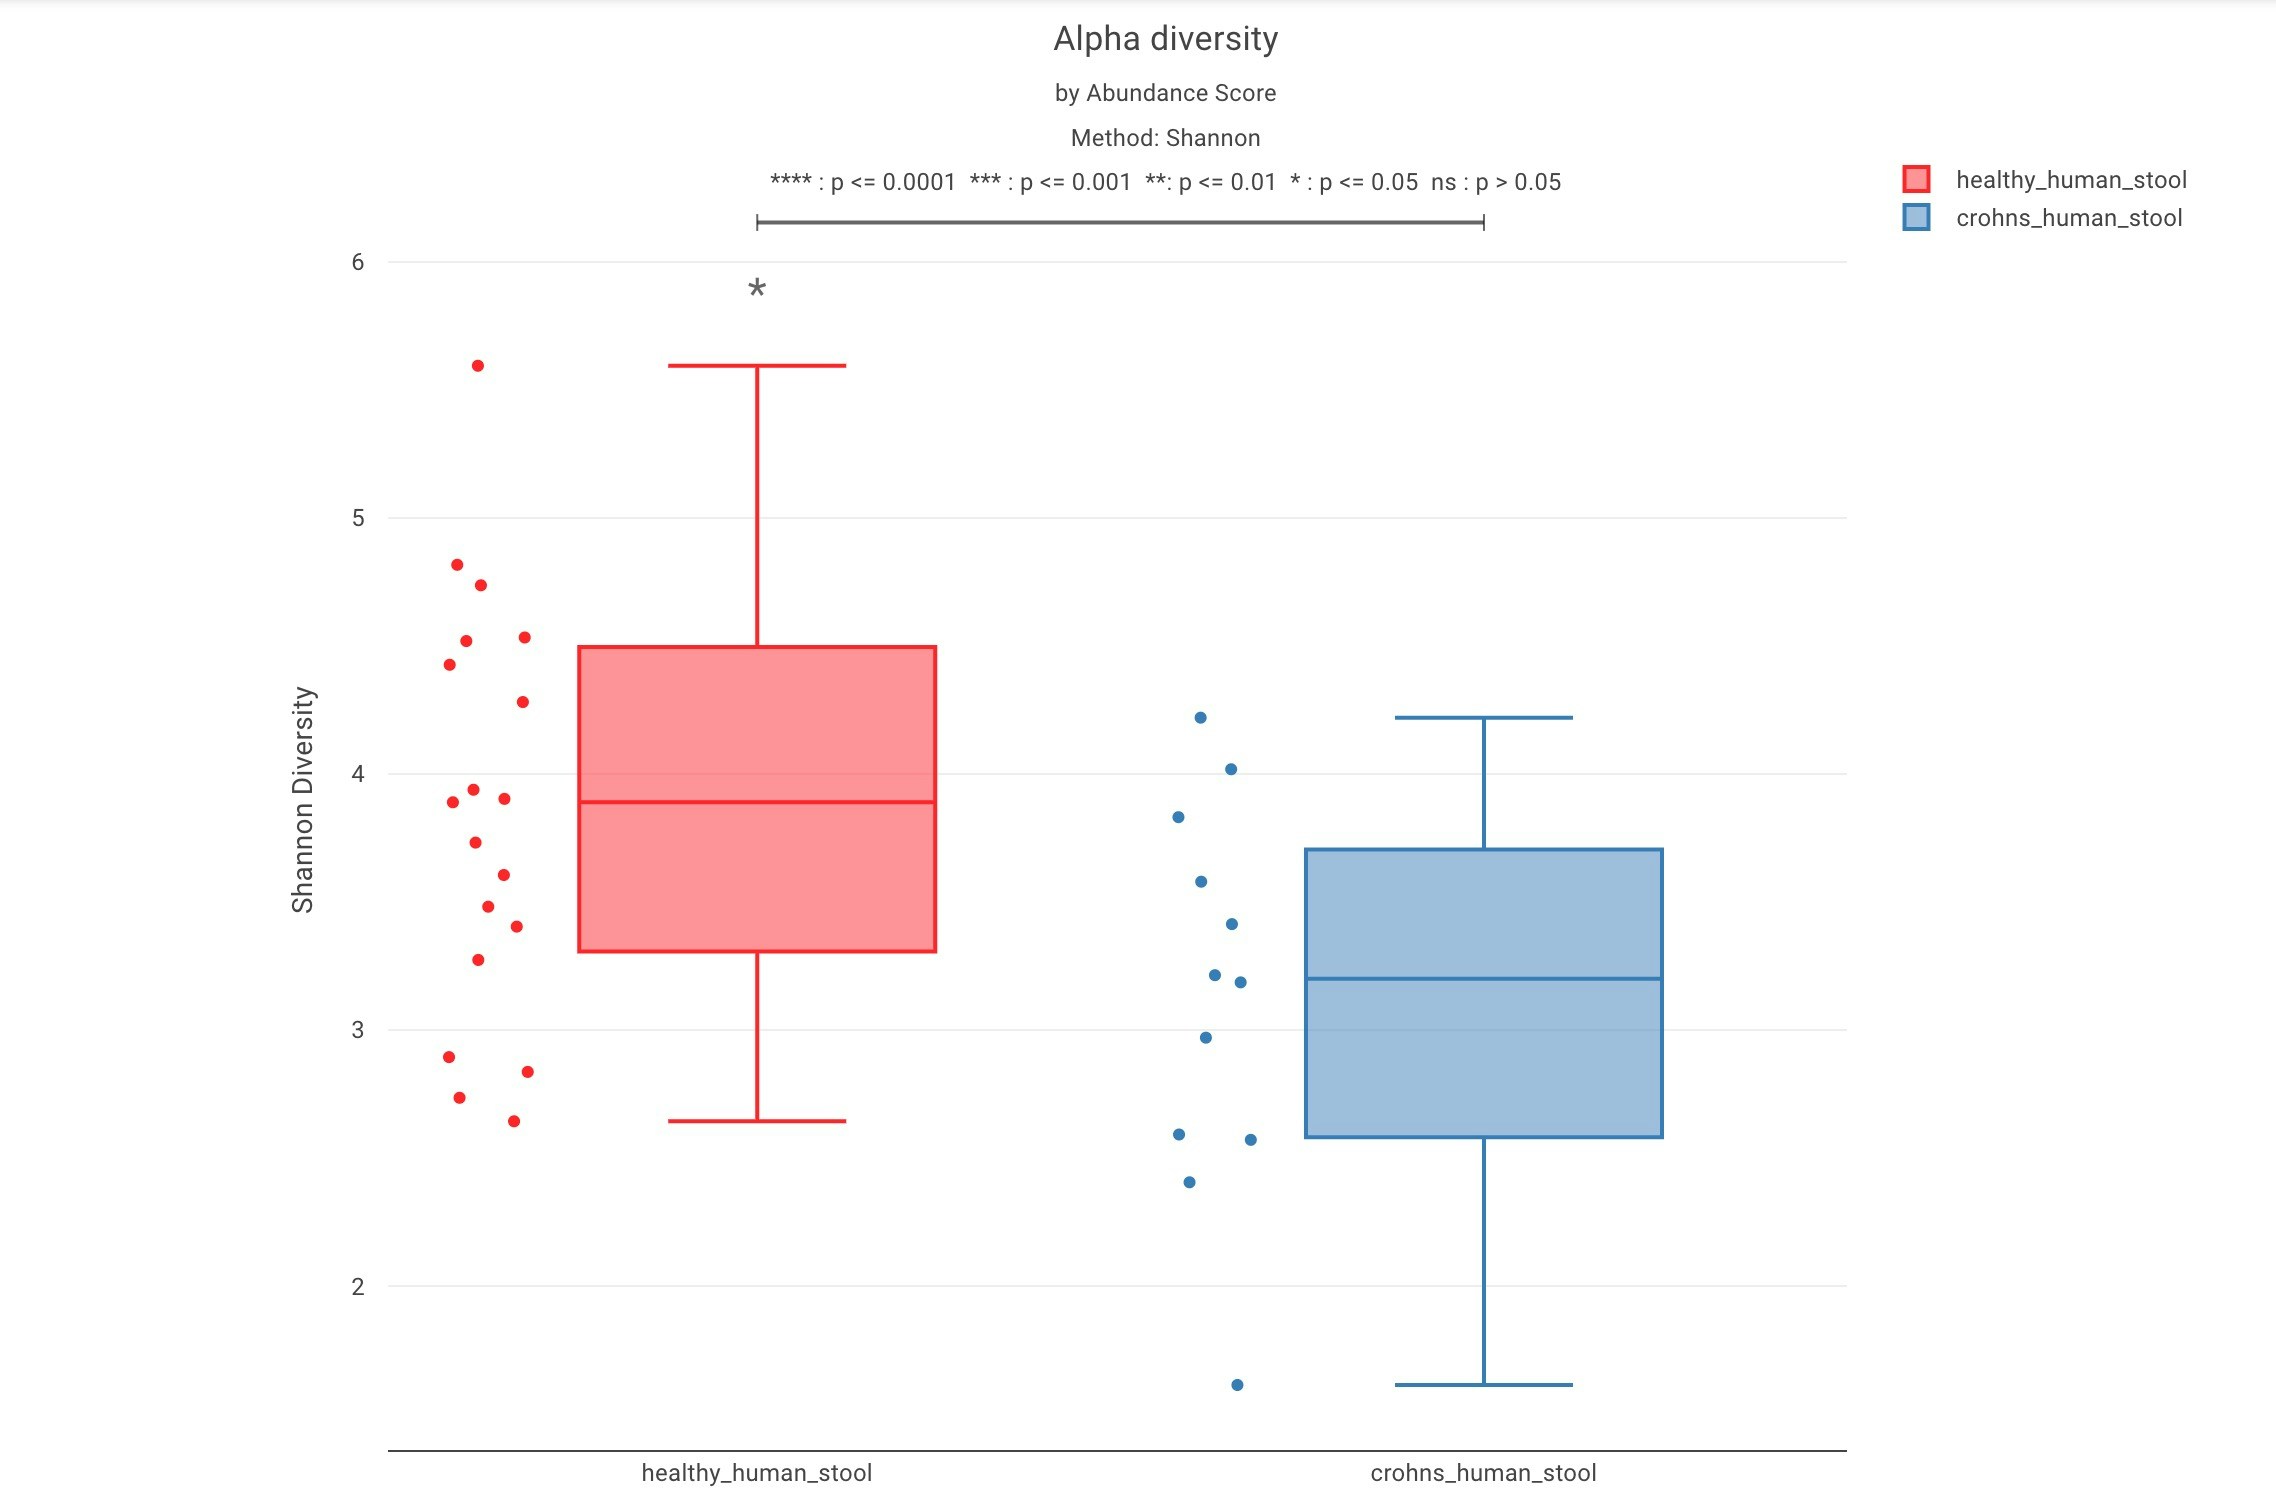
Box plots
Users have the option to visualize the alpha diversity distribution using box plot for each sample cohort selected using labels when creating comparative analysis: Wilcoxon rank sum test can also be overlayed on the boxplot chart by turning on the add wilcoxon overlay toggle
Citations
Chao1 Index (Chao, A. (1987). “Estimating the population size for capture-recapture data with unequal catchability.” Biometrics 43(4): 783–791.+
Shannon-Weaver Index (Shannon, C. E. (1948). “A mathematical theory of communication.” Bell System Technical Journal, 27, 379–423 & 623–656.)
Simpson Index (Simpson, E. H. (1949). “Measurement of diversity.” Nature, 163(4148), 688.)