What is beta diversity and how is it calculated?
In a microbiome study, beta diversity can indicate how environmental factors, treatments, or other variables may affect microbial composition. For example, samples from a healthy gut microbiome may cluster closely together on a PCoA plot, whereas samples from a diseased gut may be more spread out, indicating greater variability in microbial composition. Beta diversity is the ratio between the regional and local species diversity. In other words, it measures the distance or dissimilarity between each sample pair. Relative abundance is used as the input metric to reflect the underlying microbiome composition of the community. The aggregation level of the input data has been set to species level.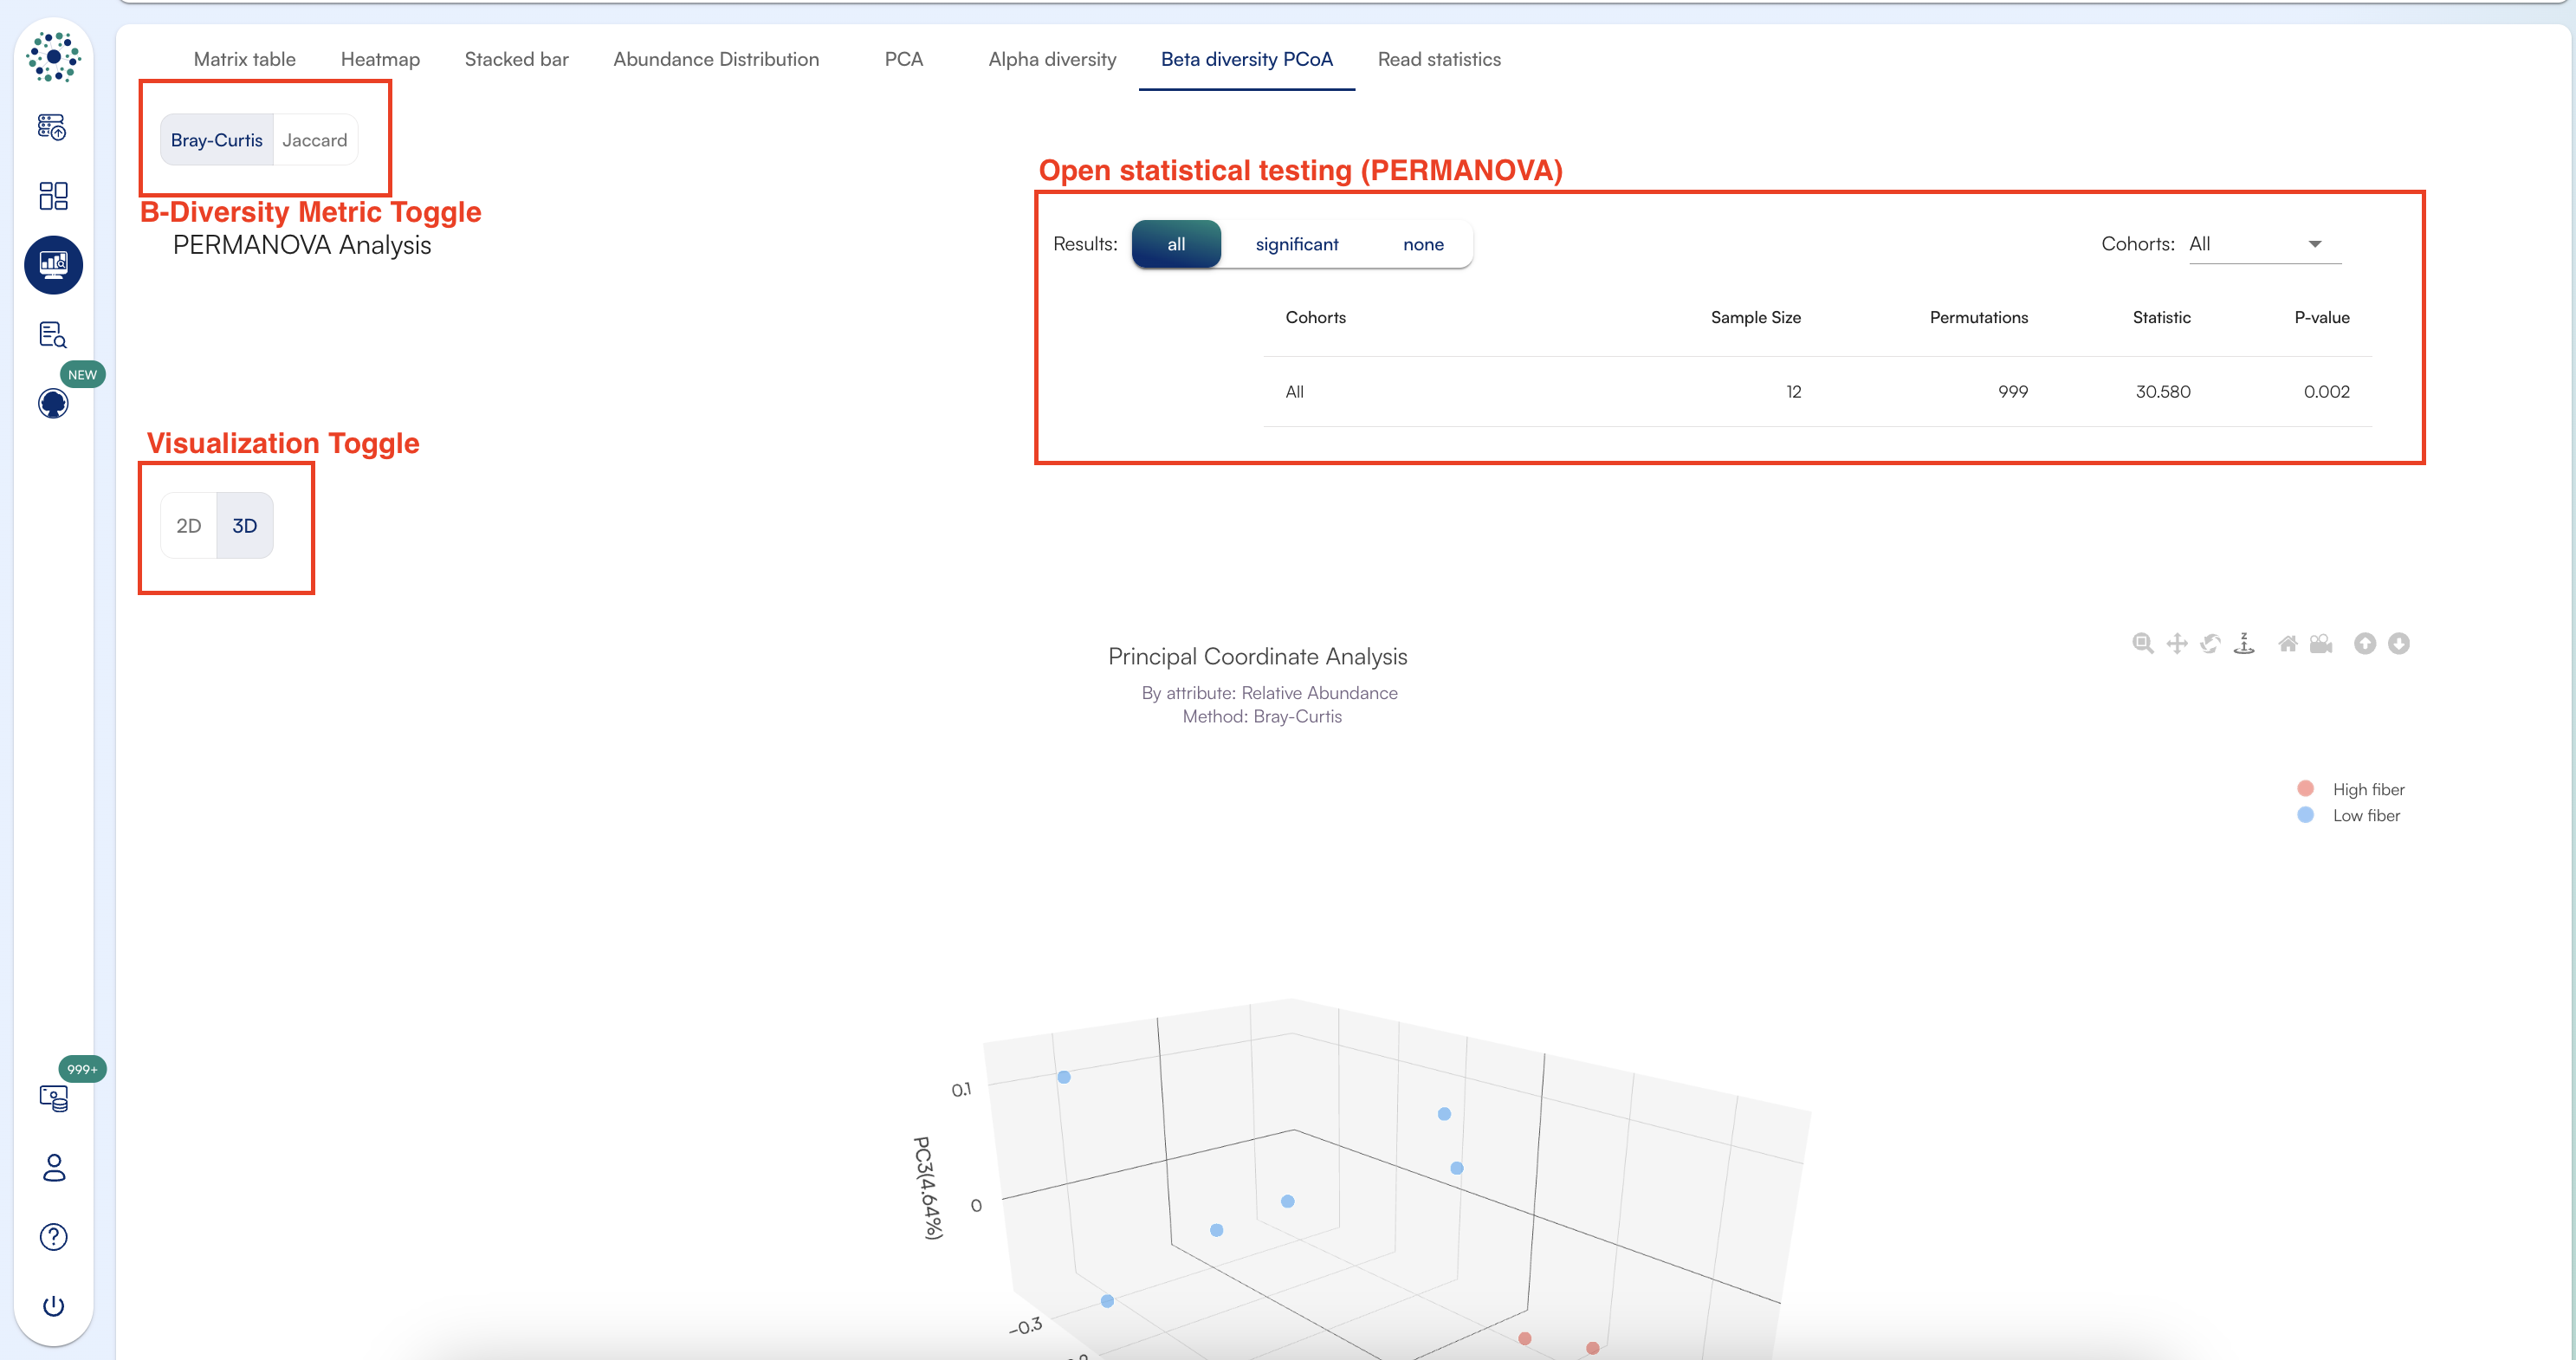
Measures of Beta Diversity
Not sure which metric to use? Or don’t know the difference between Alpha and Beta diversity?Read our page on Beta Diversity Metrics: What They Mean & When to Use Them
- Bray-Curtis (recommended)
- Jaccard
Citation: Bray, J. R. & Curtis, J. T. (1957). “An ordination of the upland forest communities of southern Wisconsin.” Ecological Monographs, 27, 325–349.Bray Curtis DissimilarityThis metric compares the abundance of species between samples. It ranges from 0 to 1, where 0 means the samples have identical compositions, and 1 means they are completely different. Imagine comparing two fruit baskets: if both have the same types and amounts of fruit, their Bray-Curtis score would be 0. If one basket is full of apples and the other is filled with oranges, the score would be closer to 1.This metric takes abundance into account and is non-phylogeny based.
PCoA
Cosmos-Hub uses PCoA (Principal Coordinate Analysis) plots to visualize beta diversity results. PCoA plots represent samples in a two-dimensional space where the distance between points reflects the dissimilarity between samples.- Bray-Curtis PCoA plots will show how much the composition of species differs between samples based on their relative abundances.
- Jaccard PCoA plots will reflect whether or not species are present in both samples, without considering how many of each species are found.
Options for viewing PCoA
- 2D/3D View - The switcher to switch between 2D and 3D view
- Rotate graph - Click anywhere on the PCoA and hold down to rotate the graph.
- Labels - You can click on a label to hide samples belonging to the corresponding cohort, click it again to show them.
- Please note that selecting cohort labels in the Legend does not recompute the plot but only hides/reveals the corresponding samples while rescaling the axis. The axis label values for % variability explained by each principal coordinate (PCo) axis are not recalculated and correspond to a visualization including all cohorts and samples.
- Export - Click “Export” in the top right corner to download the PCoA as a png or svg.
Beta Diversity Statistics: PERMANOVA
How does PERMANOVA work and what do the results mean?PERMANOVA (Permutational Multivariate Analysis of Variance) is a non-parametric test used to evaluate differences in beta diversity between cohorts. It calculates pairwise distances, measures within- and between-cohort variability, and employs an F test based on permutations to assess significance.A significant result (p ≤ 0.05) indicates differences in either centroid positions or dispersion among cohorts, meaning they differ compositionally.Results for each cohort comparison include sample sizes, permutation counts, F statistics, and p-values, all exportable as TSV.Viewing the test resultsThe Result Switcher (default: “NONE”) above the charts enables viewing results for either “ALL” cohort comparisons or only those with “SIGNIFICANT” differences (p<0.05).The Cohort Menu allows further filtering of cohort comparisons via checkboxes, adjusting the displayed results accordingly. Export options to TSV are available.