Overview
The Internal Transcribed Spacer (ITS) region is the universal DNA barcode marker for fungi. ITS amplicon sequencing enables identification and quantification of fungal communities in environmental, clinical, and agricultural samples. The Cosmos-Hub ITS workflow processes your sequencing data and classifies fungi using the UNITE reference database.When to use ITS sequencing
ITS amplicon sequencing is ideal for:- Fungal diversity studies — Characterize mycobiome composition in soil, plant, or host-associated samples
- Clinical mycology — Identify fungal pathogens in patient samples
- Food and fermentation — Monitor fungal communities in food production
- Agricultural research — Study plant-fungal interactions and soil health
ITS sequencing targets fungi specifically. For bacterial profiling, use the 16S Amplicon workflow. For comprehensive microbial profiling including bacteria, fungi, and viruses, consider shotgun metagenomics.
Understanding ITS results
When you view your ITS sample results from the datasets dashboard, you’ll see a table with the following columns: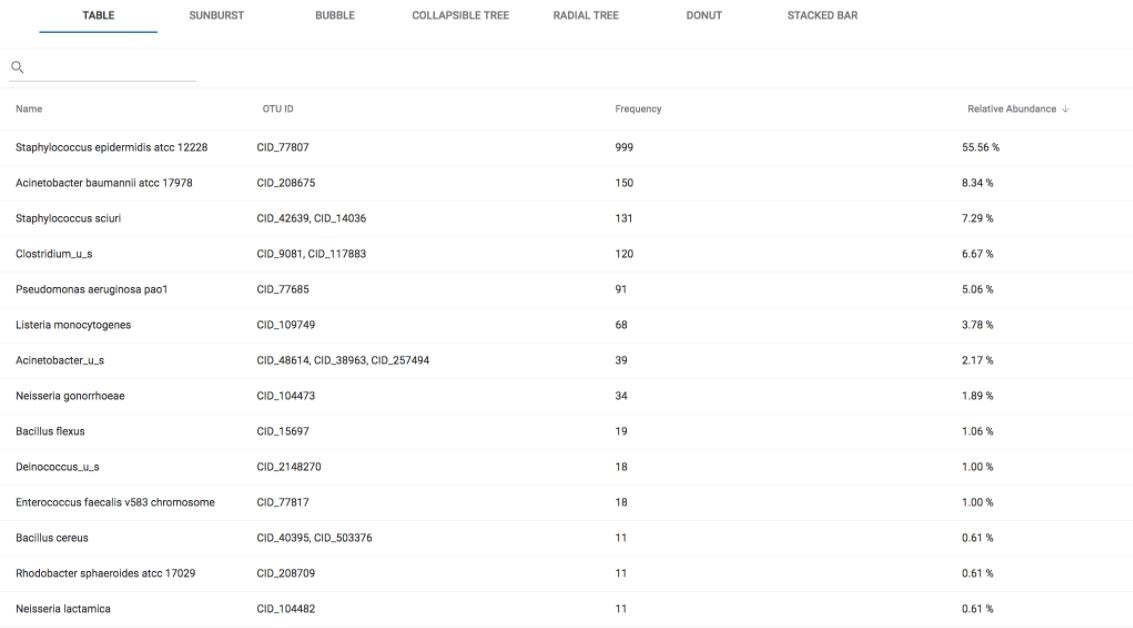
What is an OTU?
An Operational Taxonomic Unit (OTU) is a cluster of similar DNA sequences used as a proxy for species or taxonomic groups. In the ITS workflow, sequences sharing 97% or greater similarity are grouped into the same OTU. This clustering approach accounts for sequencing errors and minor intraspecific variation while maintaining taxonomic resolution.Technical methods
The Cosmos-Hub ITS pipeline processes your data through the following steps:1. Preprocessing
Raw reads from paired-end or single-end FASTQ files undergo quality filtering:- Adapter trimming removes technical sequences
- Low-quality reads and bases are filtered out
- For paired-end data, overlapping forward and reverse reads are merged; unjoined reads are appended to the end of the file
2. Format conversion
Preprocessed reads are converted from FASTQ to FASTA format for OTU picking.3. OTU clustering and classification
OTUs are identified using the QIIME framework with:- Reference database: UNITE Database version 8.3
- Method: Closed-reference OTU picking
- Similarity threshold: 97% sequence identity