Functional Profiling in Cosmos-Hub
Cosmos-Hub delivers an end-to-end, host-agnostic workflow for characterizing the functional potential of microbiomes across research, clinical, and environmental projects. The platform integrates state-of-the-art bioinformatics for read QC, translated gene family assignment, annotation, normalization, and interactive visualization.Functional Databases Available in the Cosmos-Hub
Pipeline Overview
Viewing the Functional Profiling Results
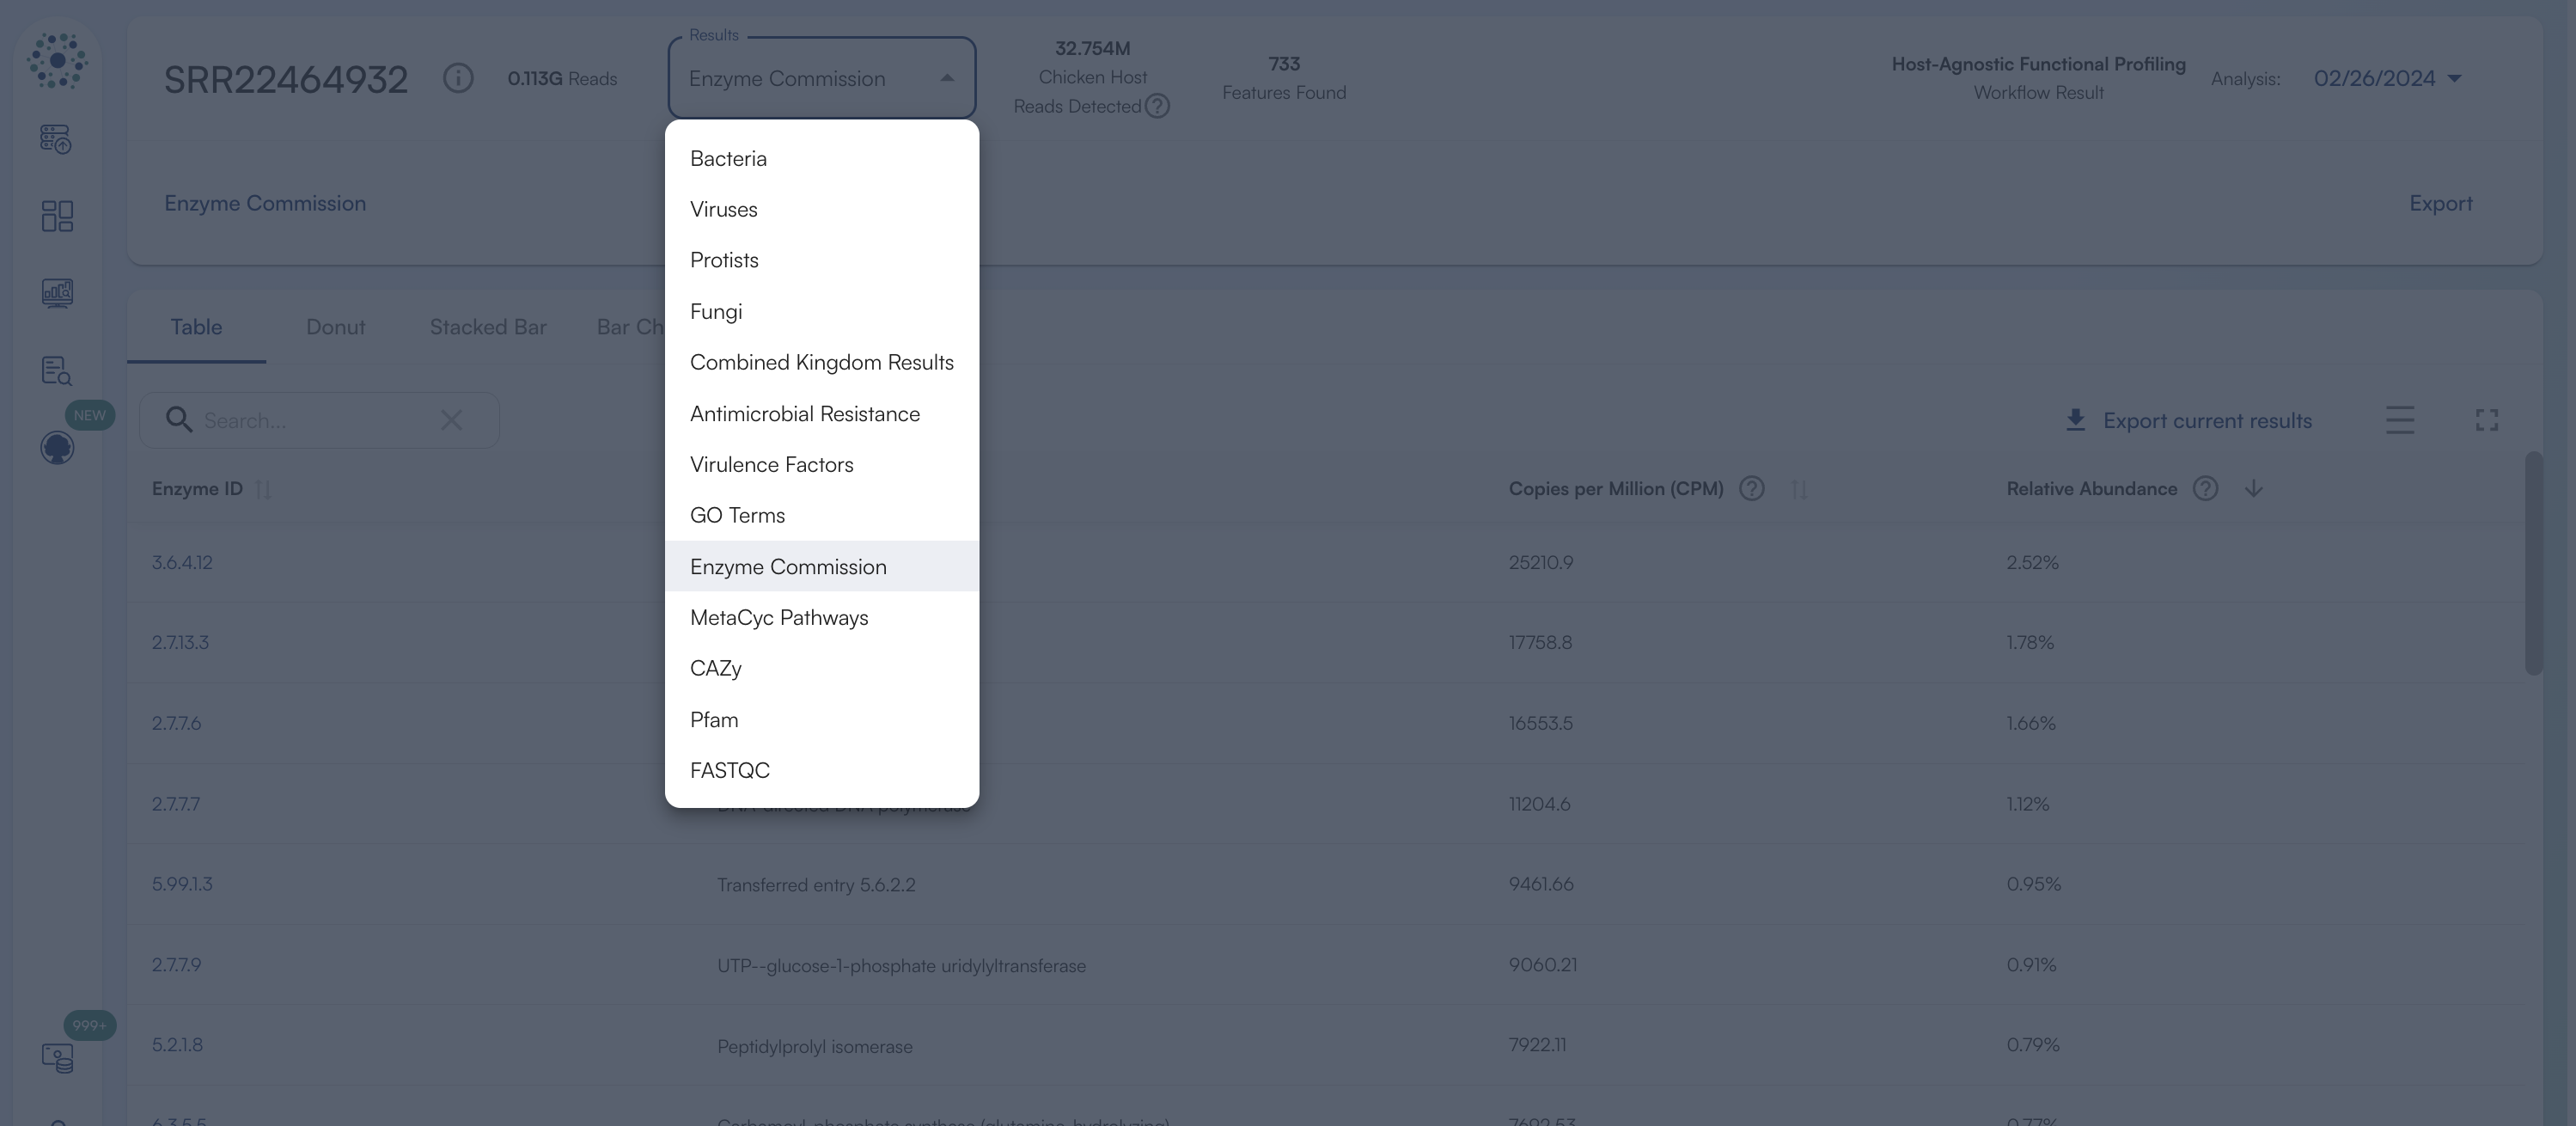
Each sample’s functional analysis can be navigated using the “Results” dropdown in the Sample Menu, which includes:
- A tabular summary of database-level annotations
- Visual charts for intuitive inspection of pathway and enzymatic profiles
- Links for feature-level exploration on source database websites
Accessing the Reference Database Entries via Hyperlinks
Clicking on the first column for each respective functional databases will take you to that specific feature’s description on that respective database’s website.
Technical Notes
- Reads mapped with weighting for mapping quality, coverage, and gene sequence length.
- Annotations use curated crosswalks from UniRef90 to EC, MetaCyc, Pfam, CAZy, and GO Terms.
- Abundance values normalized for sequencing depth using Total-sum scaling (TSS) (copies per million).
- Reference guides: Bushnell 2021, UniProt 2016, Franzosa et al. 2018, Caspi et al. 2007, Carbon et al. 2008.
Why perform functional analysis on your microbiome data?
Example Use Cases of Functional Profiling for Gut Microbiome
Healthy vs. Disease (e.g., Inflammatory Bowel Disease)
Enzyme Commission (EC): pinpointing altered enzymatic activity
Enzyme Commission (EC): pinpointing altered enzymatic activity
Cosmos-Hub identifies specific enzyme families (via EC numbers) whose abundance changes between groups.
- Healthy gut: Higher abundance of enzymes such as butyrate kinase (EC 2.7.2.7) and acetate-CoA transferase (EC 2.8.3.8), reflecting active short-chain fatty acid (SCFA) production that supports gut barrier integrity.
- IBD gut: Increased nitrate reductase (EC 1.7.99.4) and formate dehydrogenase (EC 1.17.1.9), suggesting a shift toward oxidative and nitrate respiration, consistent with inflammatory and dysbiotic states.
MetaCyc Pathways: reconstructing disrupted metabolic networks
MetaCyc Pathways: reconstructing disrupted metabolic networks
Using EC annotations, Cosmos-Hub infers pathway presence and abundance through MetaCyc.
- Healthy gut: Enrichment in pathways like butyrate biosynthesis I (PWY-5676), methanogenesis from H₂/CO₂ (METHANOGENESIS-PWY), and vitamin K₂ (menaquinone) biosynthesis (PWY-5838) — all key for maintaining energy balance and mucosal health.
- IBD gut: Enrichment in lipopolysaccharide (LPS) biosynthesis and nitrate reduction pathways, consistent with a pro-inflammatory metabolic signature.
Pfam: detecting shifts in protein architecture and stress functions
Pfam: detecting shifts in protein architecture and stress functions
Pfam domain profiling highlights structural motifs that increase in disease.
- Healthy gut: More ABC transporter permease domains (PF02653) supporting nutrient import/export.
- IBD gut: Elevated TonB-dependent receptor domains (PF00593) and heat shock protein domains (PF00012), reflecting stress adaptation and host-derived substrate utilization.
CAZy: revealing changes in carbohydrate metabolism
CAZy: revealing changes in carbohydrate metabolism
Carbohydrate-active enzymes show clear ecological reprogramming:
- Healthy gut: Enrichment of GH43 and GH3 families involved in dietary fiber degradation (xylan, arabinoxylan, cellulose).
- IBD gut: Drop in fiber-degrading CAZymes and rise in GH98 and GH92 families targeting host mucins, suggesting a shift toward mucosal glycan foraging.
GO Terms: summarizing broad biological trends
GO Terms: summarizing broad biological trends
At the ontology level, Cosmos-Hub maps genes to GO terms to show system-wide changes:
- Healthy gut: Enrichment in oxidation-reduction process and fermentation (biological process), cell wall biosynthesis (molecular function).
- IBD gut: Upregulation of response to oxidative stress, iron ion transport, and biofilm formation — markers of an inflamed microenvironment.
Technical Appendix
FUNCTIONAL Workflow:
Initial QC, adapter trimming and preprocessing of metagenomic sequencing reads are done using BBduk (1). The quality controlled reads are then subjected to a translated search against a comprehensive and non-redundant protein sequence database, UniRef 90. The UniRef90 database, provided by UniProt (2), represents a clustering of all non-redundant protein sequences in UniProt, such that each sequence in a cluster aligns with 90% identity and 80% coverage of the longest sequence in the cluster. The mapping of metagenomic reads to gene sequences are weighted by mapping quality, coverage and gene sequence length to estimate community wide weighted gene family abundances as described by Franzosa et al (3). Gene families are then annotated to MetaCyc (4) reactions (Metabolic Enzymes) to reconstruct and quantify MetaCyc (4) metabolic pathways in the community as described by Franzosa et al (3). Furthermore, the UniRef_90 gene families are also regrouped to Enzyme Commission Enzymes, Pfam protein domains, CAZy enzymes and GO Terms in order to get an exhaustive overview of gene functions in the community. Lastly, to facilitate comparisons across multiple samples with different sequencing depths, the abundance values are normalized using Total-sum scaling (TSS) normalization to produce “Copies per million” (analogous to TPMs in RNA-Seq) units. References:- Bushnell, B. (2021). BBDuk Guide - DOE Joint Genome Institute. Retrieved 1 August 2021, from https://jgi.doe.gov/data-and-tools/bbtools/bb-tools-user-guide/bbduk-guide/
- UniProt: the universal protein knowledgebase. (2016). Nucleic Acids Research, 45(D1), D158-D169. doi: 10.1093/nar/gkw1099
- Franzosa, E., McIver, L., Rahnavard, G., Thompson, L., Schirmer, M., & Weingart, G. et al. (2018). Species-level functional profiling of metagenomes and metatranscriptomes. Nature Methods, 15(11), 962-968. doi: 10.1038/s41592-018-0176-y
- Caspi, R., Foerster, H., Fulcher, C., Kaipa, P., Krummenacker, M., & Latendresse, M. et al. (2007). The MetaCyc Database of metabolic pathways and enzymes and the BioCyc collection of Pathway/Genome Databases. Nucleic Acids Research, 36(Database), D623-D631. doi: 10.1093/nar/gkm900
- Carbon, S., Ireland, A., Mungall, C., Shu, S., Marshall, B., & Lewis, S. (2008). AmiGO: online access to ontology and annotation data. Bioinformatics, 25(2), 288-289. doi: 10.1093/bioinformatics/btn615