Viewing Sample Results
From the Samples menu, click on a sample name. You will see sample information, navigation controls at the top, and a table with microbial results.
Number of Total # Reads in Sample
The top navigation bar provides sample details, database navigation, filtered vs. unfiltered views, and taxonomy level controls.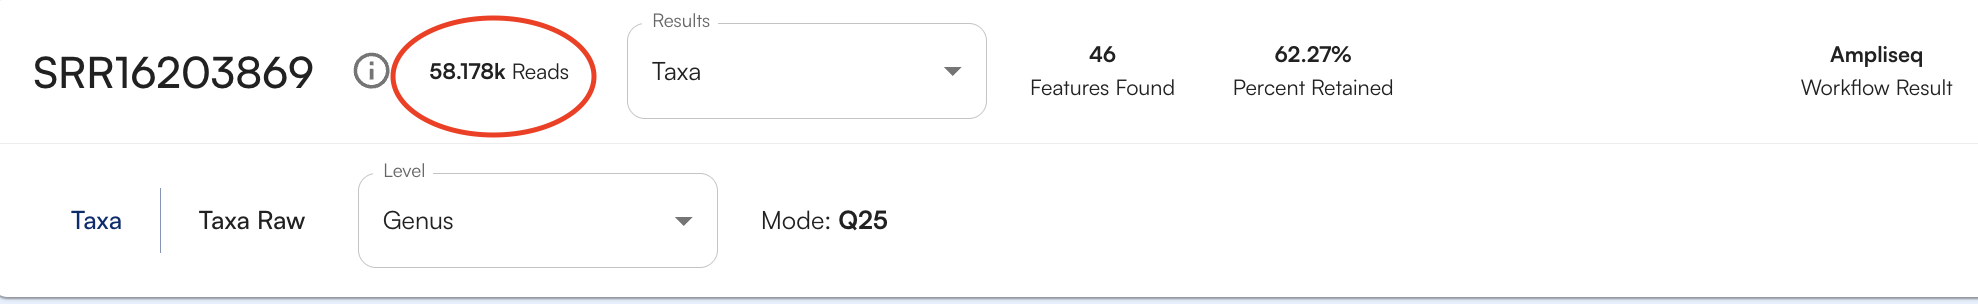
Number of Organisms/Genes Found
To see how many organisms or genes (depending on the database being viewed) were identified for your sample, look at the number features found, as circled below.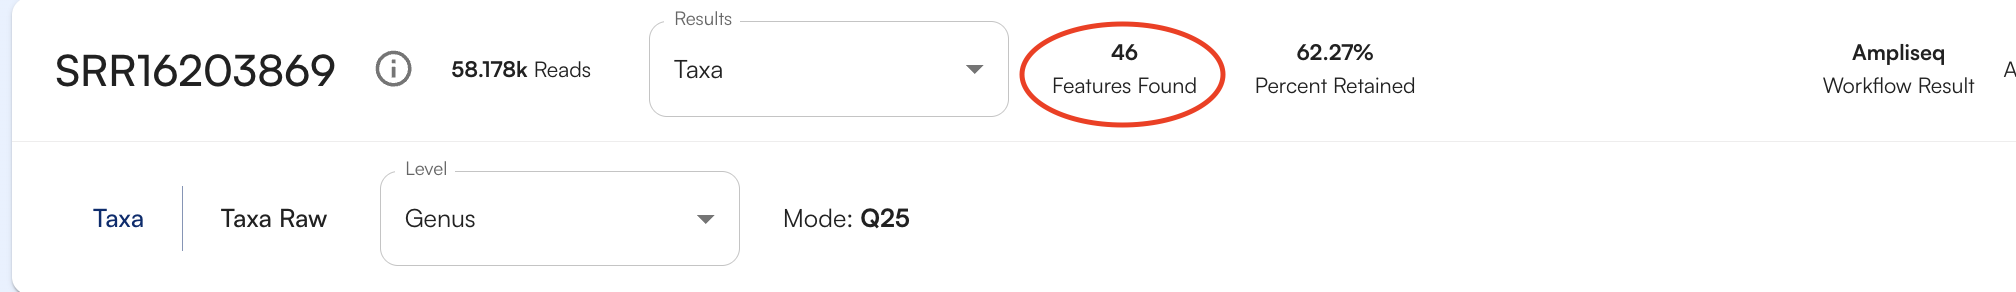
% Reads assigned to taxonomy/genes
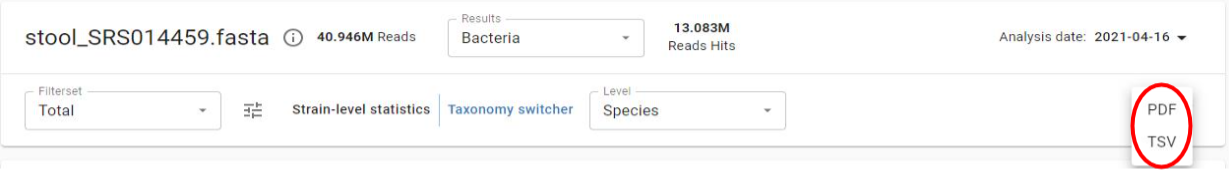
The number of taxonomically significant hits that were found in your sample and used to make identifications are listed as a number followed by Reads Hit.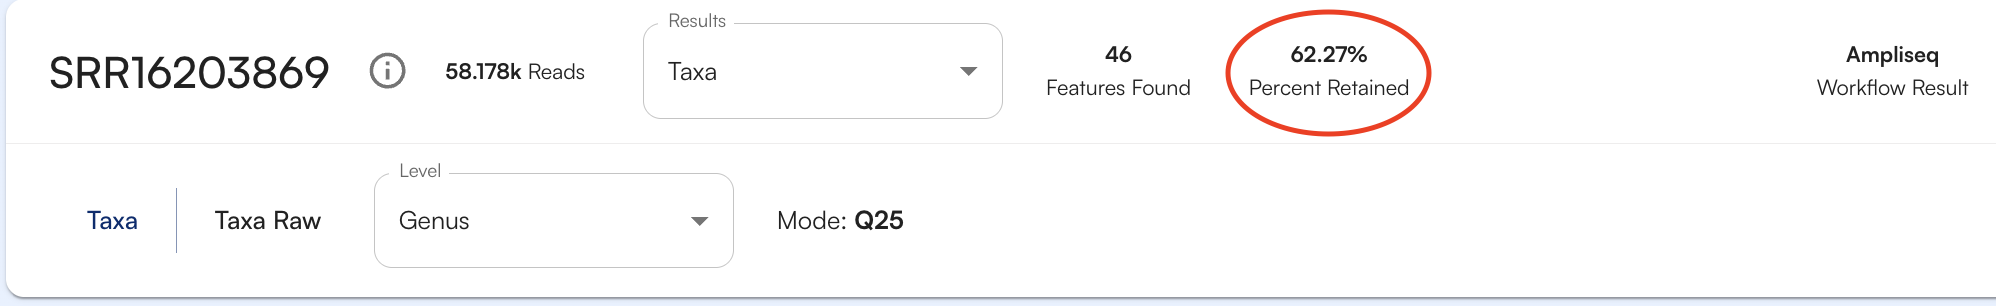
Switching Databases

- Bacteria
- Fungi
- Protists
- Antibiotic Resistance
- Virulence Factors
- MetaCyc
- Pfam
- EnzymeCommission
- CAZy
- GO Terms
- CHAMP-Taxa
- Gut-Metaboloic Module
- Gut-Brain Module
- KEGG Terms
- KEGG Ontology
- FASTQ
Filtered versus total results
You are able to view both filtered and unfiltered (total) results for your sample. Filtered results contain the calls that have met the threshold for high confidence that the organism called is in the sample. Unfiltered results contain additional calls that are below the filtering threshold and may need further validation to determine if they are truly present in the sample.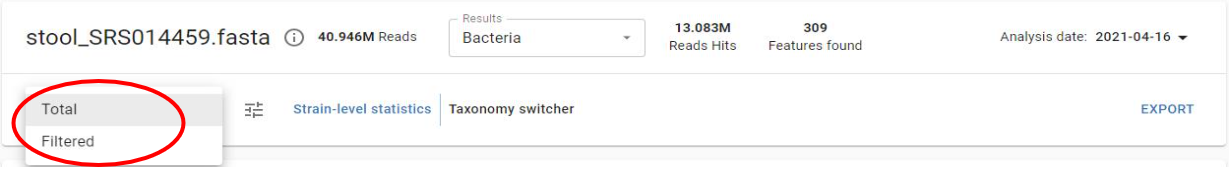
When to use filtered results
You would typically use filtered results when you are looking at data where you want high confidence in your calls, like when working with clinical data. Many people use unfiltered (total) results when looking at environmental samples where there may be organisms whose genomes are more novel or diverge from most reference genomes.How filtering works
The filtering threshold which determines if results are considered significant is based on internal statistical scores determined by analyzing a large number of diverse metagenomes. Organisms listed in the filtered results are likely to be present in the sample. Unfiltered (total) results include those in the filtered results and usually additional organisms. Organisms listed in the unfiltered (total) results but not in the filtered results need further validation to determine if they are actually present in the sample - either by deeper sequencing of the sample followed by re-analysis or by orthogonal validation using targeted PCR or other methods.Taxonomy Switcher
The taxonomy switcher button allows you to select the taxonomic level results to view for both the sample dashboard table and the sample visualizations.
Sample and Visualization Export