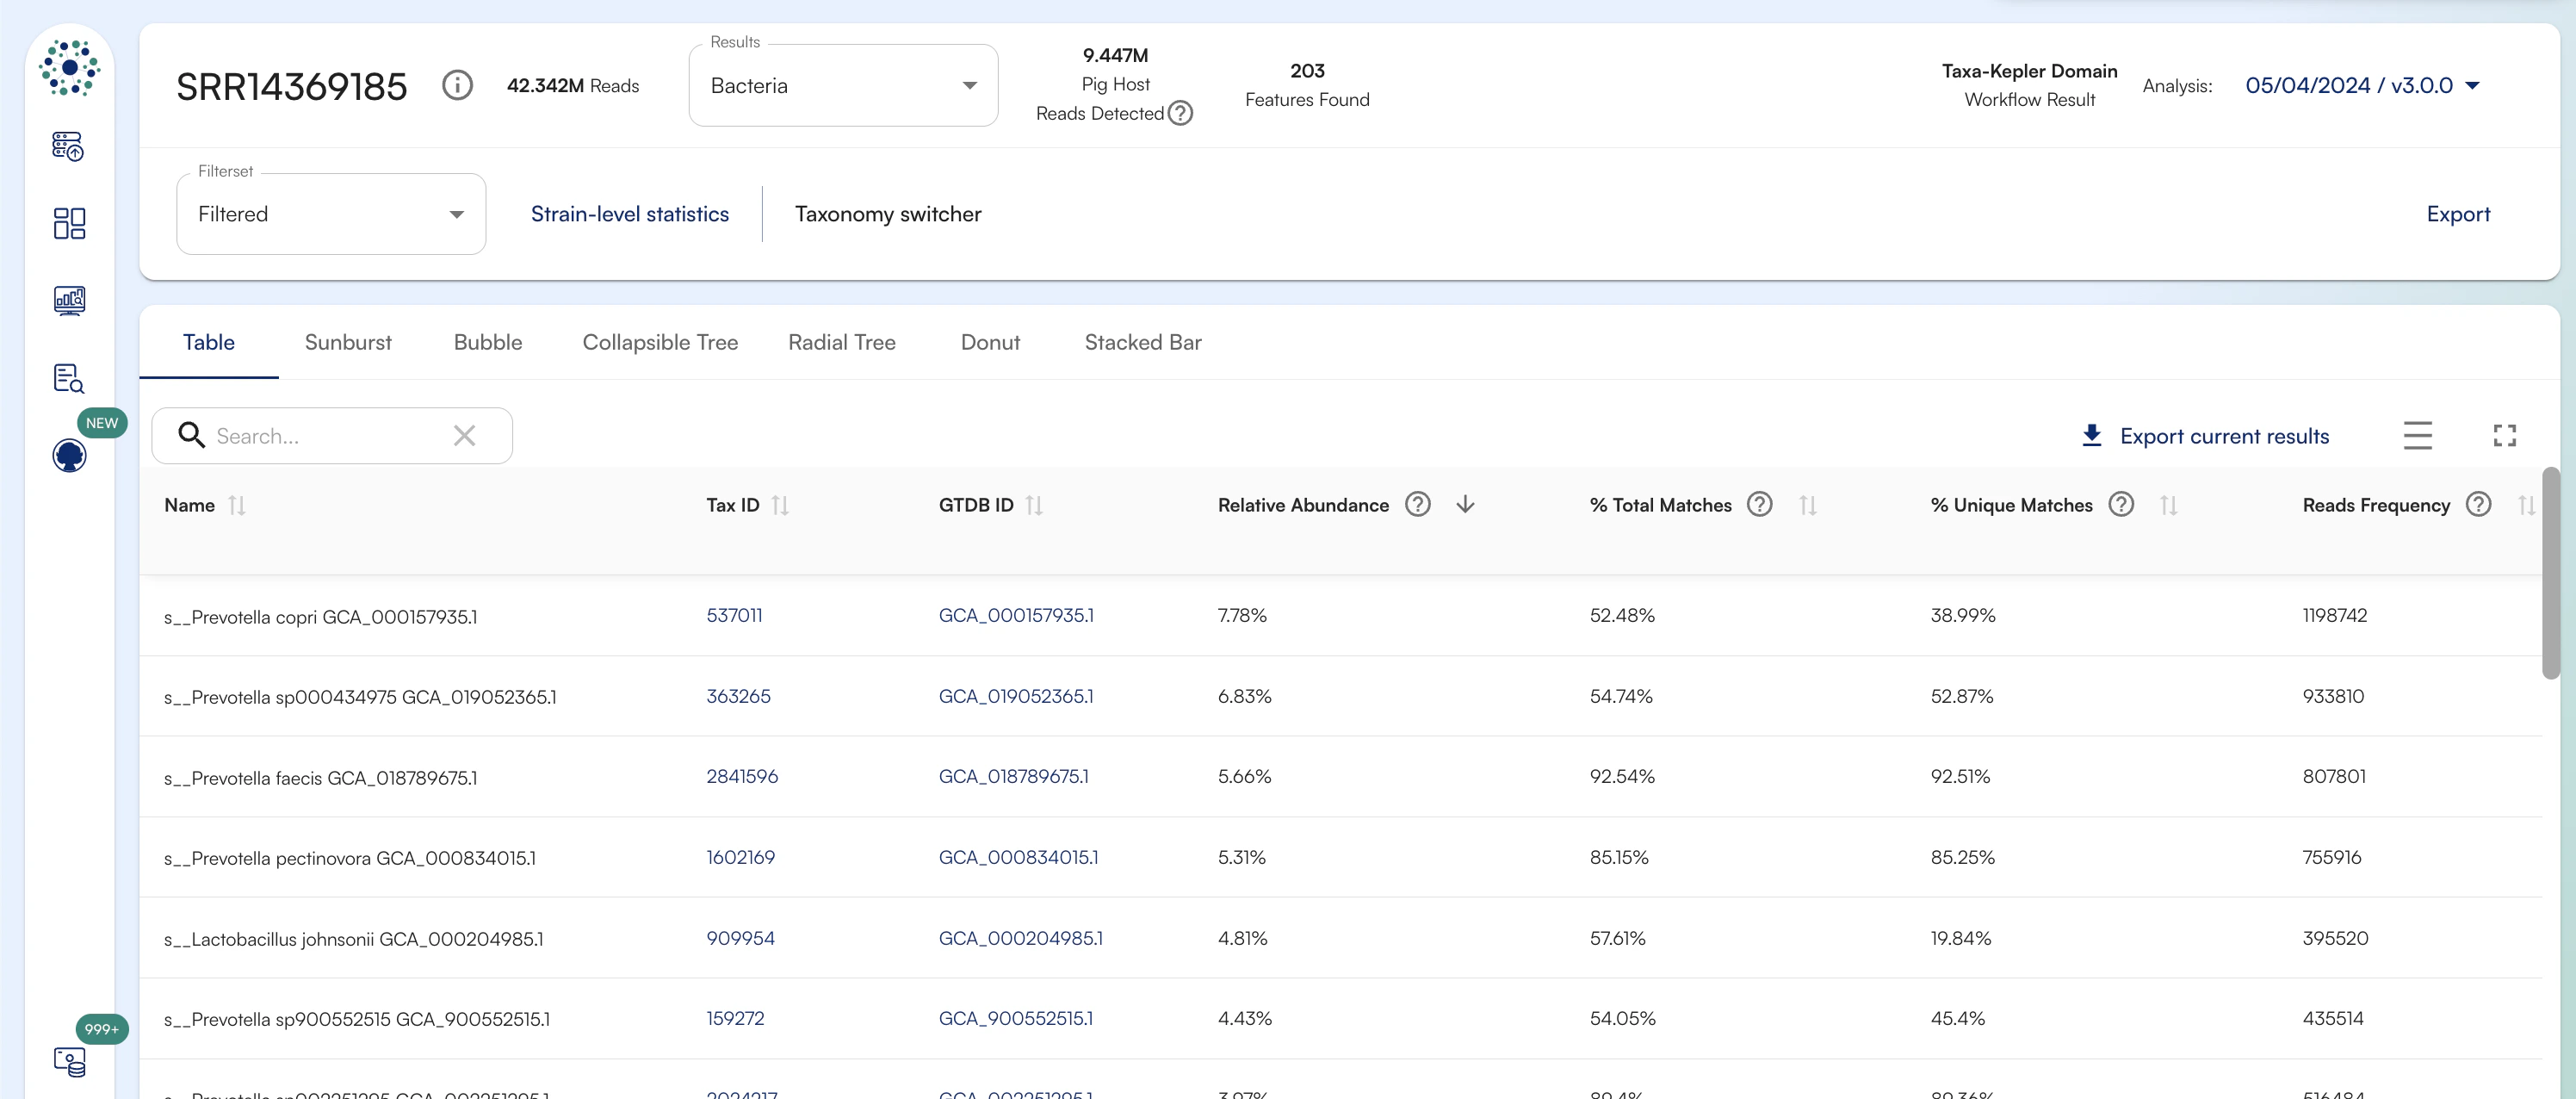
Sample Abundance Table

The sample abundance table is the main page for viewing individual samples. You will see the results listed for the database you have selected and you can navigate through all of the databases and sample visualizations such as the sunburst, tree, and stacked bar graphs.

Definition of Columns

  • Name - the name of the organism or taxonomic level or the name of the antibiotic resistance gene or virulence factor, depending on the selected database.

  • Tax ID - a link to the NCBI taxonomic ID for the organism

  • Abundance Score - The Abundance Score is an absolute abundance metric. It is used to calculate the Relative Abundance (%). The abundance score is a normalized metric taking into consideration genome size and number of reads. This makes this metric suitable for downstream comparative analysis or differential abundance analysis.

  • Relative Abundance - The Relative Abundance describes the contribution of a given taxon to the total microbial community detected. Relative Abundance is expressed in % and calculated as follows: Relative Abundance = Abundance Score (taxon n) / Sum of Abundance Score (all taxa). This metric is suitable for downstream comparative analysis

  • Unique Matches - The number of different kmers found in the sample that are unique to the organism divided by the total number of pre-calculated unique kmers available for the organism in the database. If unique coverage is very low for an organism it could mean a couple of things:

  1. For strains, this could indicate that the exact strain in our reference database is not a perfect match to the strain in the sample. However, if you also see a high percent TOTAL coverage for this same strain, this is a good indication that a near taxonomic neighbor of the reference strain is in your sample.
  2. For some organisms that have high representation in sequencing space (E. coli, for example), there may not be many unique areas in the genome available for strain level identification. As more and more similar genomes are added to the database, we trade-off the ability to discriminate between those that are highly similar to each other. This will cause the percent unique coverage to be low.

This metric is not recommended for downstream comparative analysis. Together with other metrics this metric is used by the Filtered setting to rule out likely false positive calls.

  • Total Matches - The number of shared and unique kmers for the organism divided by the total number of pre-calculated shared plus unique matches available in the reference database. Shared kmers are shared with other similar organisms upwards the same lineage in the phylogenetic tree, which makes this a useful metric for approximating gene coverage, or for assessing the likelihood of a detected taxon or gene actually being present.

A common use of total matches is for comparative analysis of antibiotic resistance genes or virulence factors. When you do a comparative analysis for these databases you will notice that this is the default value used for the comparison. Since these databases are gene-based rather than organism-based, looking at the number of total kmers identified out of those possible enables a meaningful in understanding how well the gene has been covered by the reads in the sample.
In summary, when running a comparative analysis of antibiotic resistance genes or virulence factors then use the % Total Matches metric to compare how coverage changes between samples, and use the normalized Relative Abundance metric to compare how the composition of marker genes changes between samples.

Together with other metrics this metric is used by the Filtered setting to rule out likely false positive calls.

  • Sort - to sort samples by different columns click on the column name.

  • Search - to search for a sample name, click the magnifying glass and enter your search term:

  • Frequency - the number of unique kmer occurrences in the queried sample. This is roughly equivalent to the number of reads that matched to the organism identified. See Definitions for more information on how this works.

This metric is not recommended for comparative analysis.

To understand the top navigation menu and switching taxonomic levels, just go here: View Results.

Switching between visualizations


What’s Next