With the CosmosID app you can easily manage and view all of your samples. If needed you can create folders and move relevant samples into them to keep them organized. When you click on the folder icon on the left panel you will see all of your folders and samples.Documentation Index
Fetch the complete documentation index at: https://docs.cosmosid.com/llms.txt
Use this file to discover all available pages before exploring further.
How To View Sample Results
From main dashboard, click on a sample name.
Understanding the Top Navigation Bar
The top navigation bar provides information about your sample, allows you to navigate between different databases and filtered vs unfiltered results, and allows you to change taxonomy levels when viewing results.Number of organisms or genes found

Number of Hits Found

Number of Reads in Sample

Switching Databases
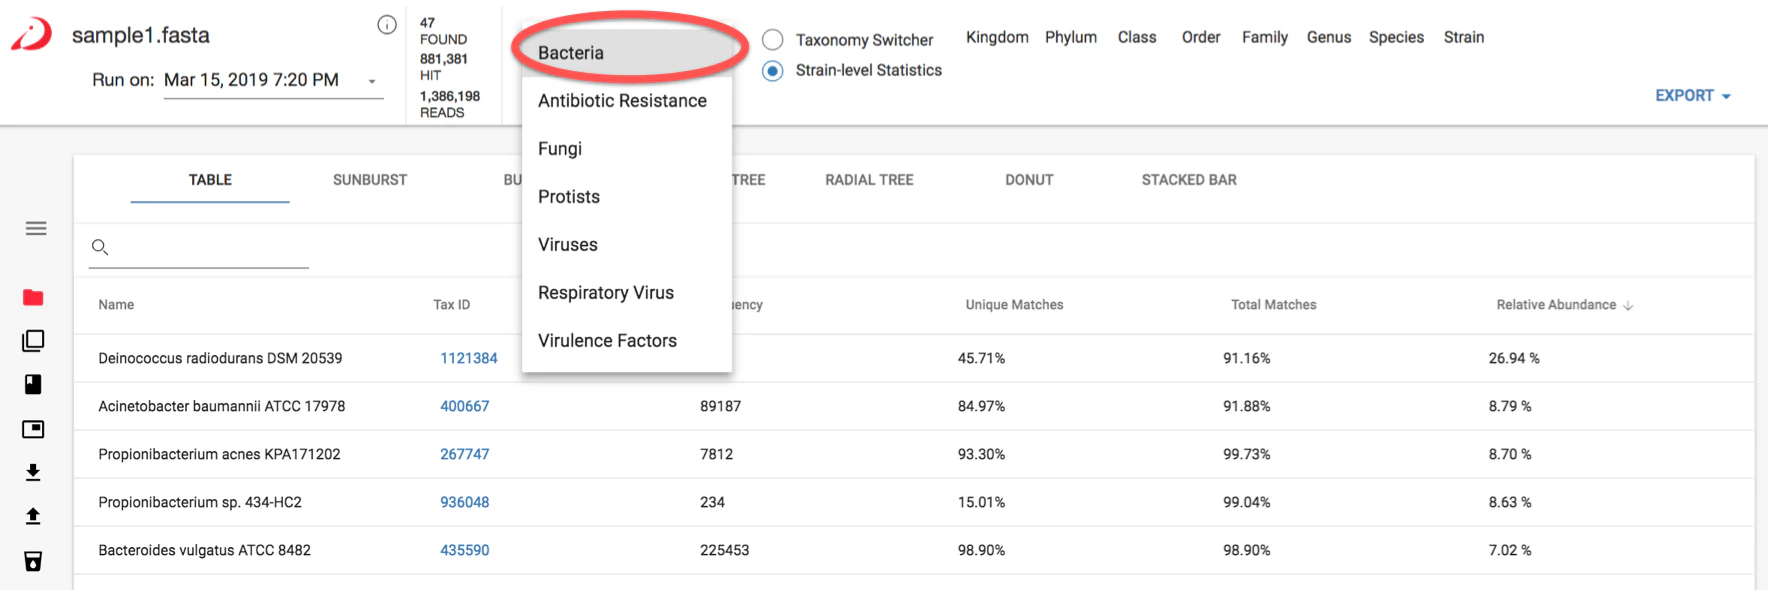
- Bacteria
- Antibiotic Resistance
- Fungi
- Protists
- Phages
- Dark Matter (Beta)
- Viruses
- Respiratory Virus
- Virulence Factors

Filtered versus total results
You are able to view both filtered and unfiltered (total) results for your sample. Filtered results contain the calls that have met the threshold for high confidence that the organism called is in the sample. Unfiltered results contain additional calls that are below the filtering threshold and may need further validation to determine if they are truly present in the sample.When to use filtered results
You would typically use filtered results when you are looking at data where you want high confidence in your calls, like when working with clinical data. Many people use unfiltered (total) results when looking at environmental samples where there may be organisms whose genomes are more novel or diverge from most reference genomes.How filtering works
The filtering threshold which determines if results are considered significant is based on internal statistical scores determined by analyzing a large number of diverse metagenomes. Organisms listed in the filtered results are likely to be present in the sample. Unfiltered (total) results include those in the filtered results and usually additional organisms. Organisms listed in the unfiltered (total) results but not in the filtered results need further validation to determine if they are actually present in the sample - either by deeper sequencing of the sample followed by re-analysis or by orthogonal validation using targeted PCR or other methods.Taxonomy Switcher

Strain Level Statistics
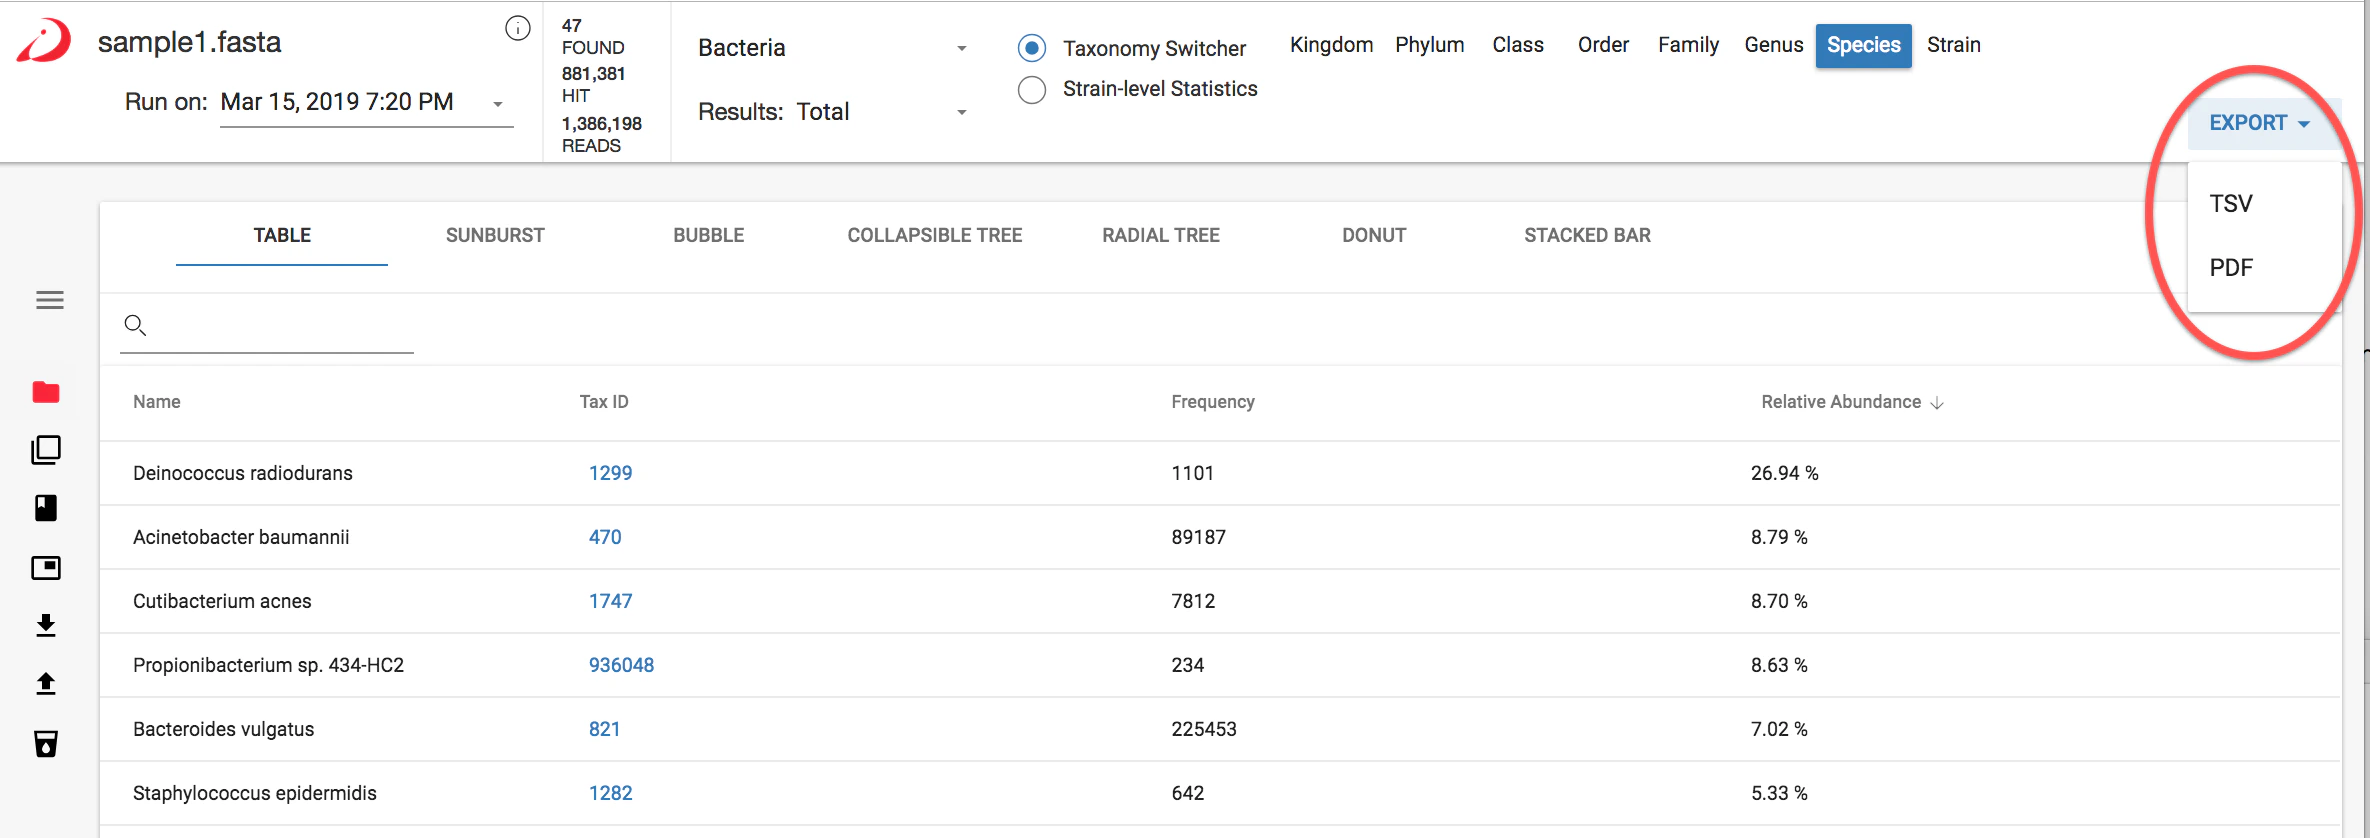
To view strain level results click “Strain” on the taxonomy switcher at the top of the window. The dashboard table view provides a strain level report.Sample and Visualization Export