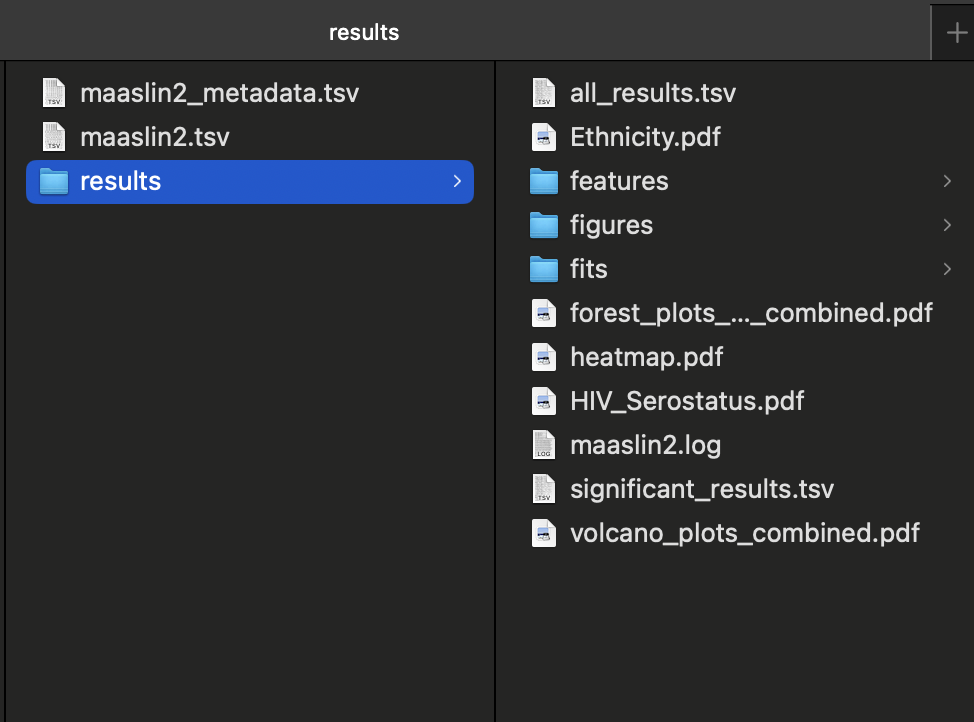
MaAsLin2 Results
Input Data
A pre-formatted .tsv table containing taxonomic or functional profiling results (values dependent on input parameters).Input Metadata
A pre-formatted .tsv table containing all sample metadata.Association Results
Perhaps the most important output from MaAsLin 2 is the list of significant associations displayed in the Association Results, which displays significant associations between metadata and microbial features along with effect size, p-values, and q-values. The full list of associations that pass MaAsLin 2’s significance threshold is ordered by increasing q-values. Columns are:- Metadata: the variable name being associated with a microbial feature.
- Feature Name: the microbial feature (taxon, gene, pathway, etc.).
- Value Name: for categorical features, the specific feature level for which the coefficient and significance of association is being reported.
- Coefficient/EffectSize: the model coefficient value
- Coefficients for categorical variables indicate the contrast between the each metadata category versus the reference.
- Standard Error: the standard error from the model.
- N: the total number of samples used in the model for this association (since minimum abundance/prevalence can exclude samples from comparisons).
- N not Zero: the total of number of these samples in which the feature is non-zero.
- P-value: the nominal significance of this association.
- Q-value: the corrected significance is computed with p.adjust with the correction method (BH, etc.).
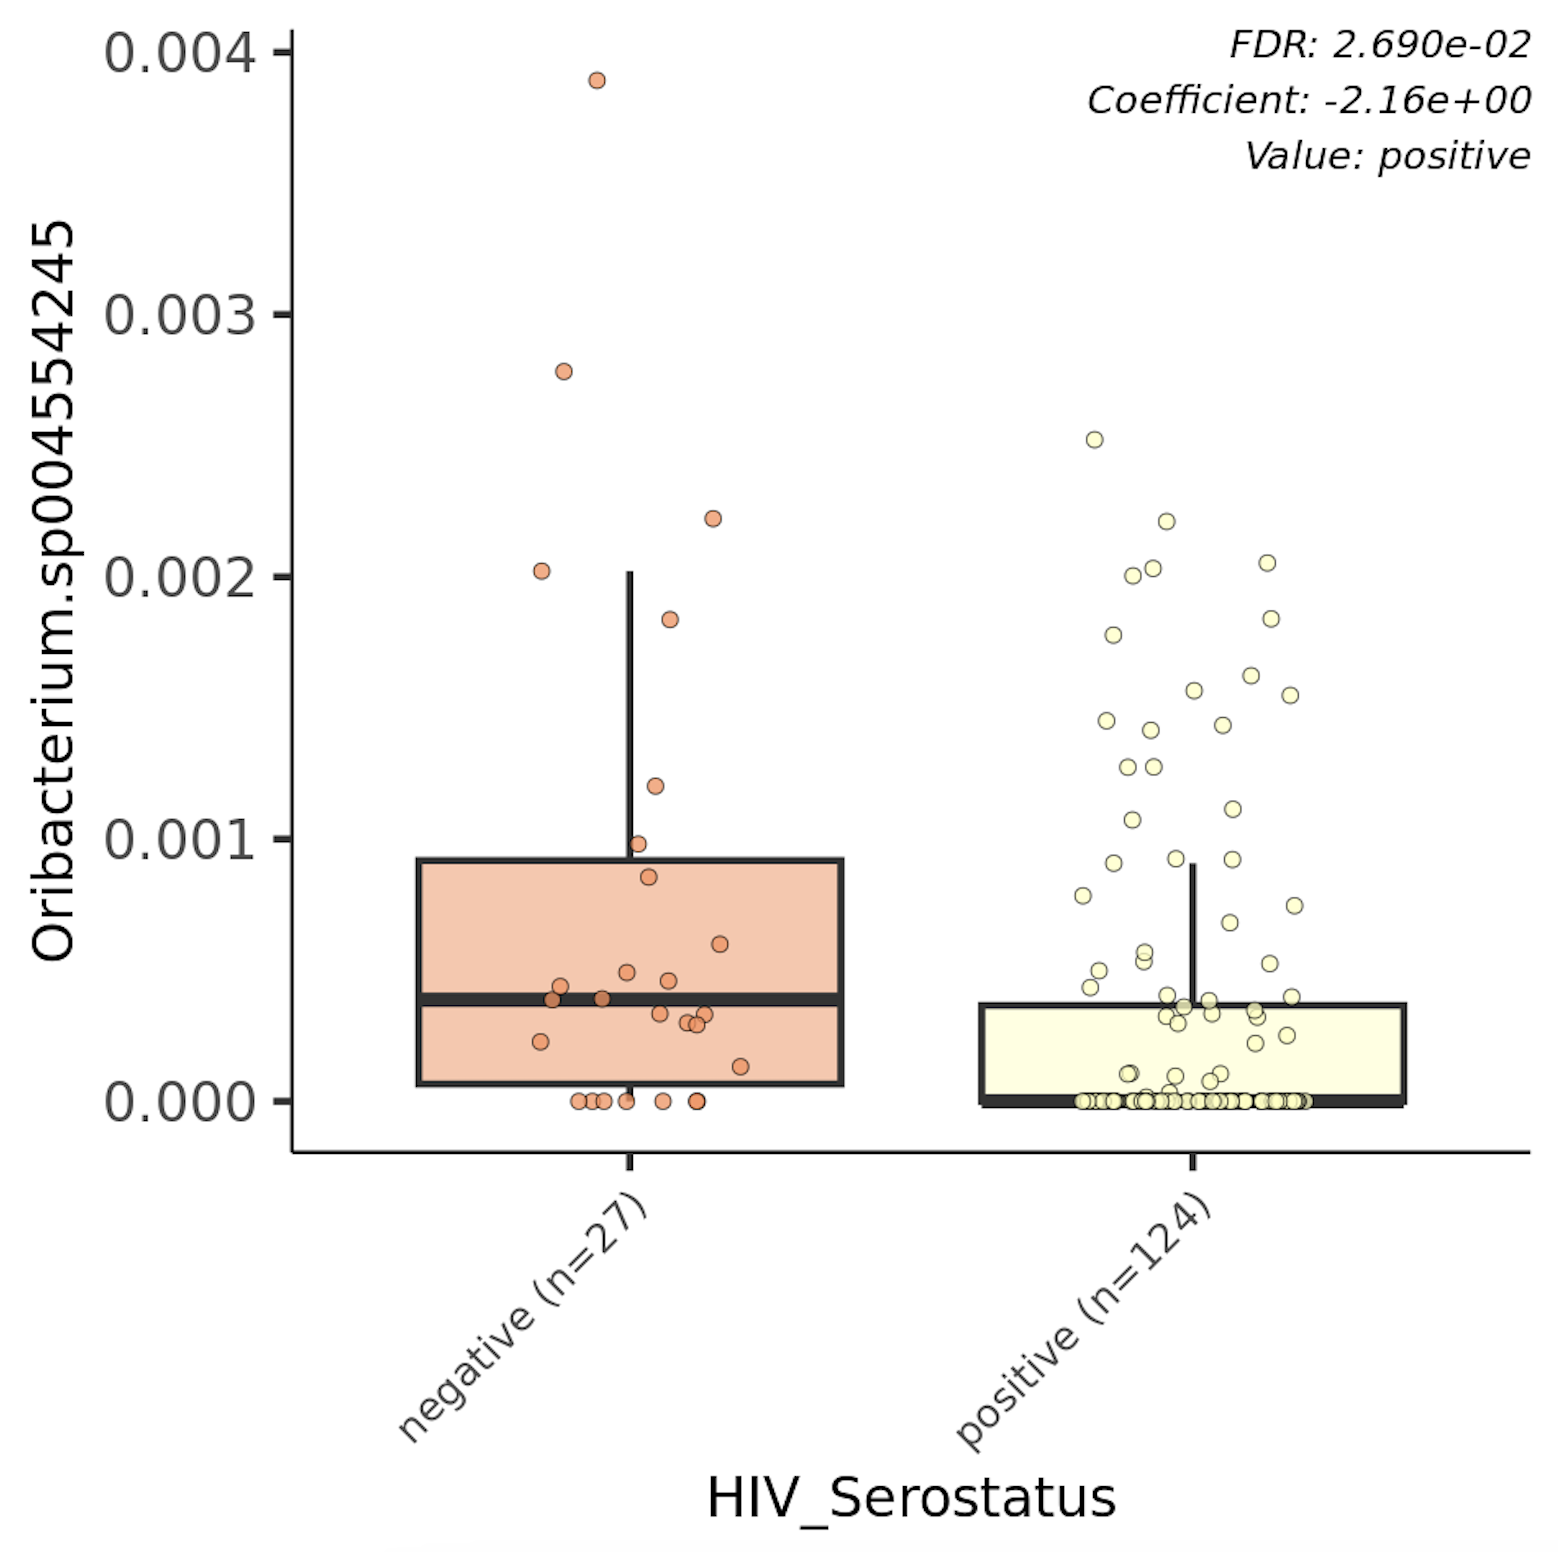
Box and Scatter Plots
A tab is presented for each Fixed Effect, which includes plots for each of the significant associations in the Association Results (boxplots for categorical variables, scatter plots for continuous). These can be viewed within the GUI and exported via .ZIP file.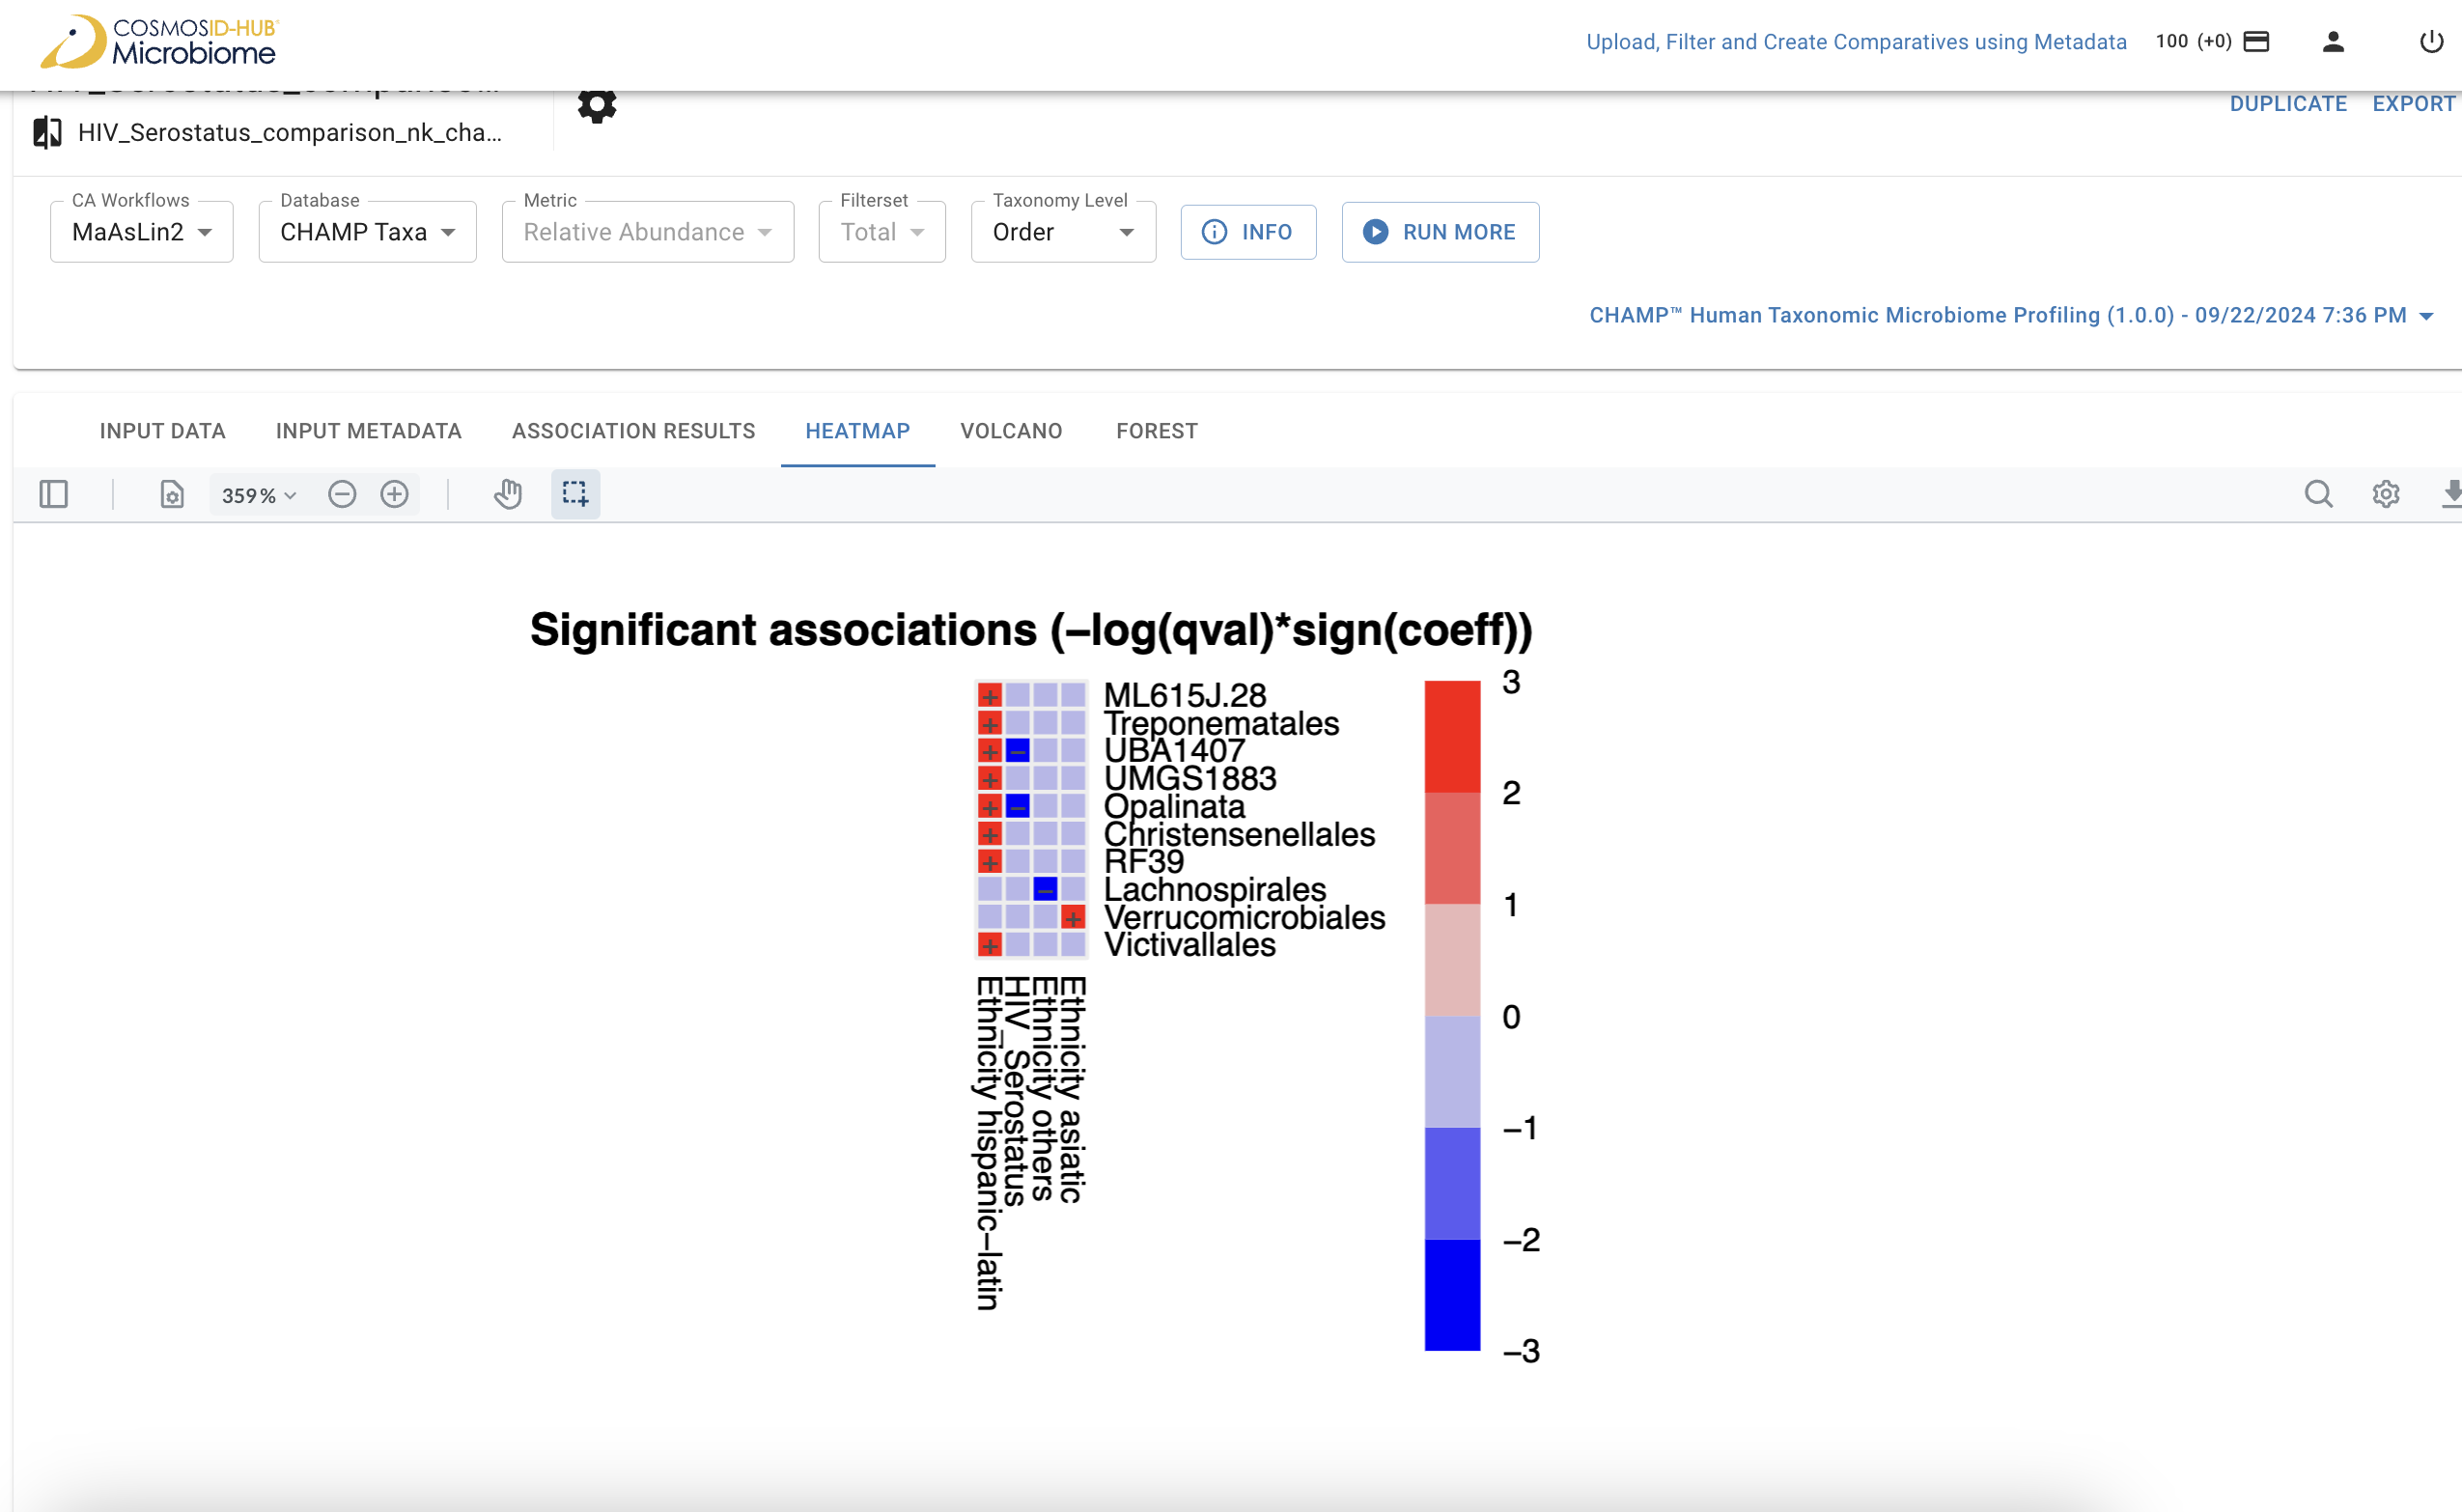
Heatmap
Top 50 (unless otherwise specified) features with significant associations.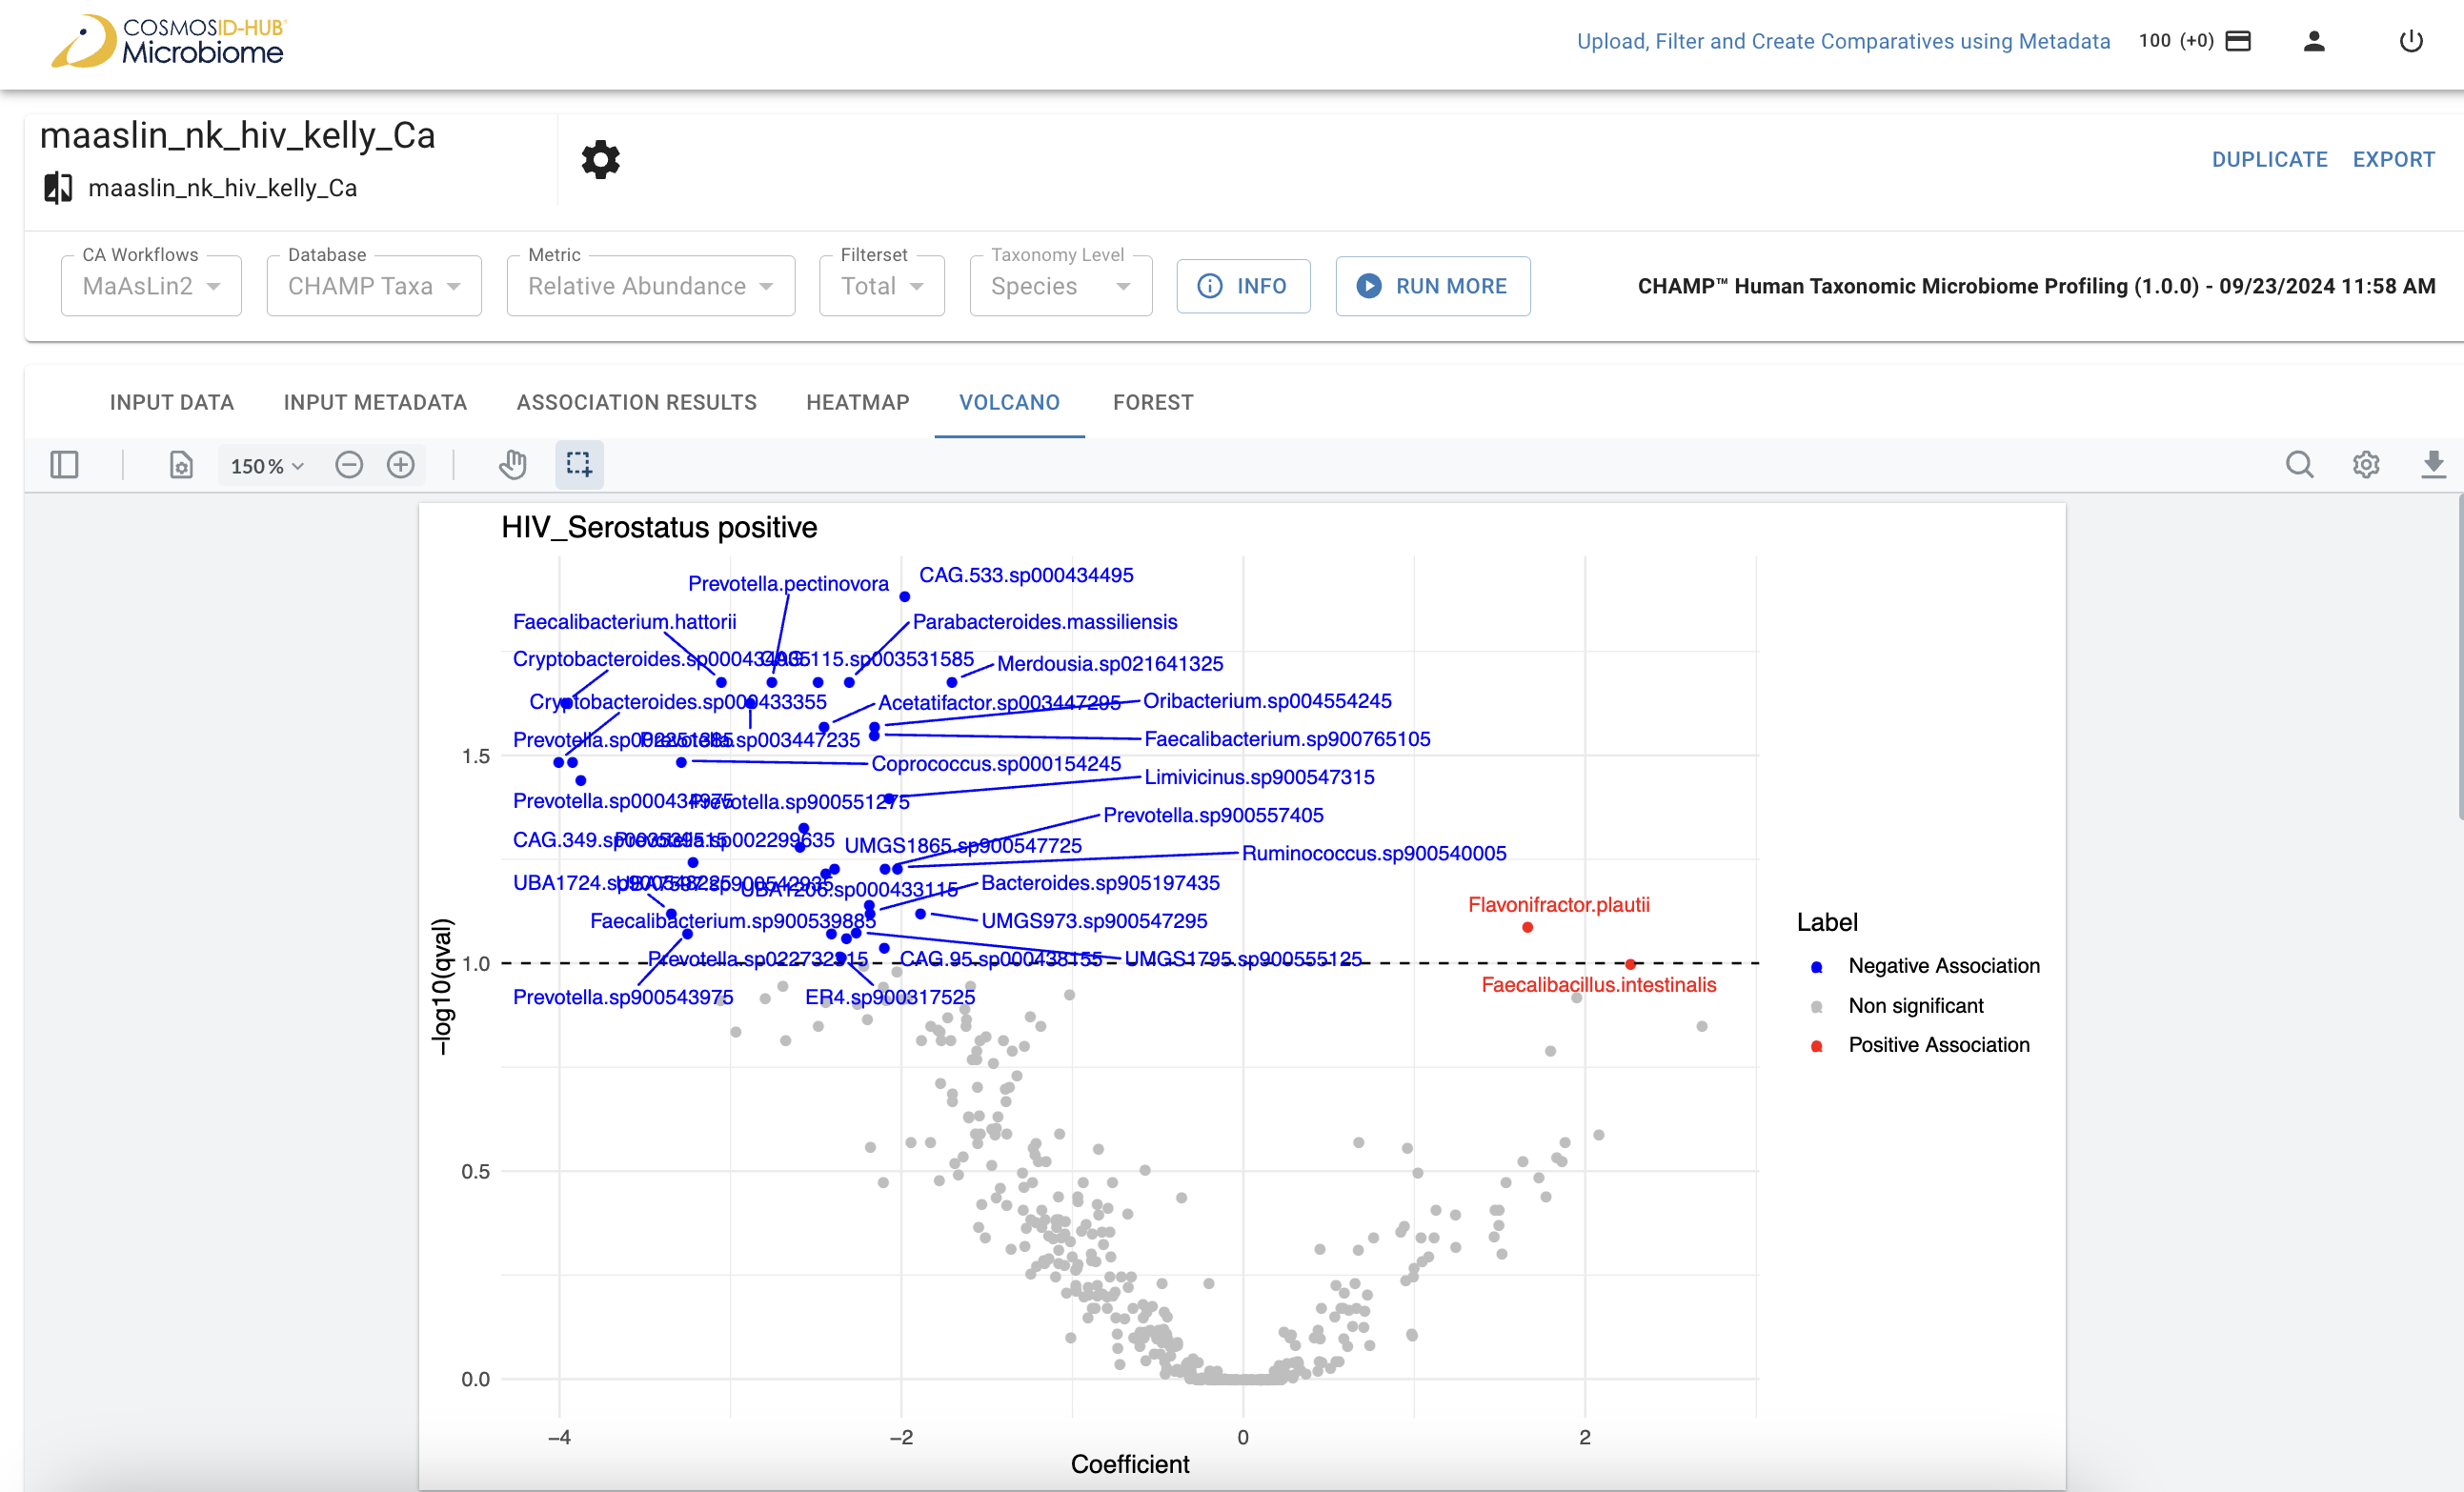
Volcano
Volcano plot depicting all significant variables for each fixed effect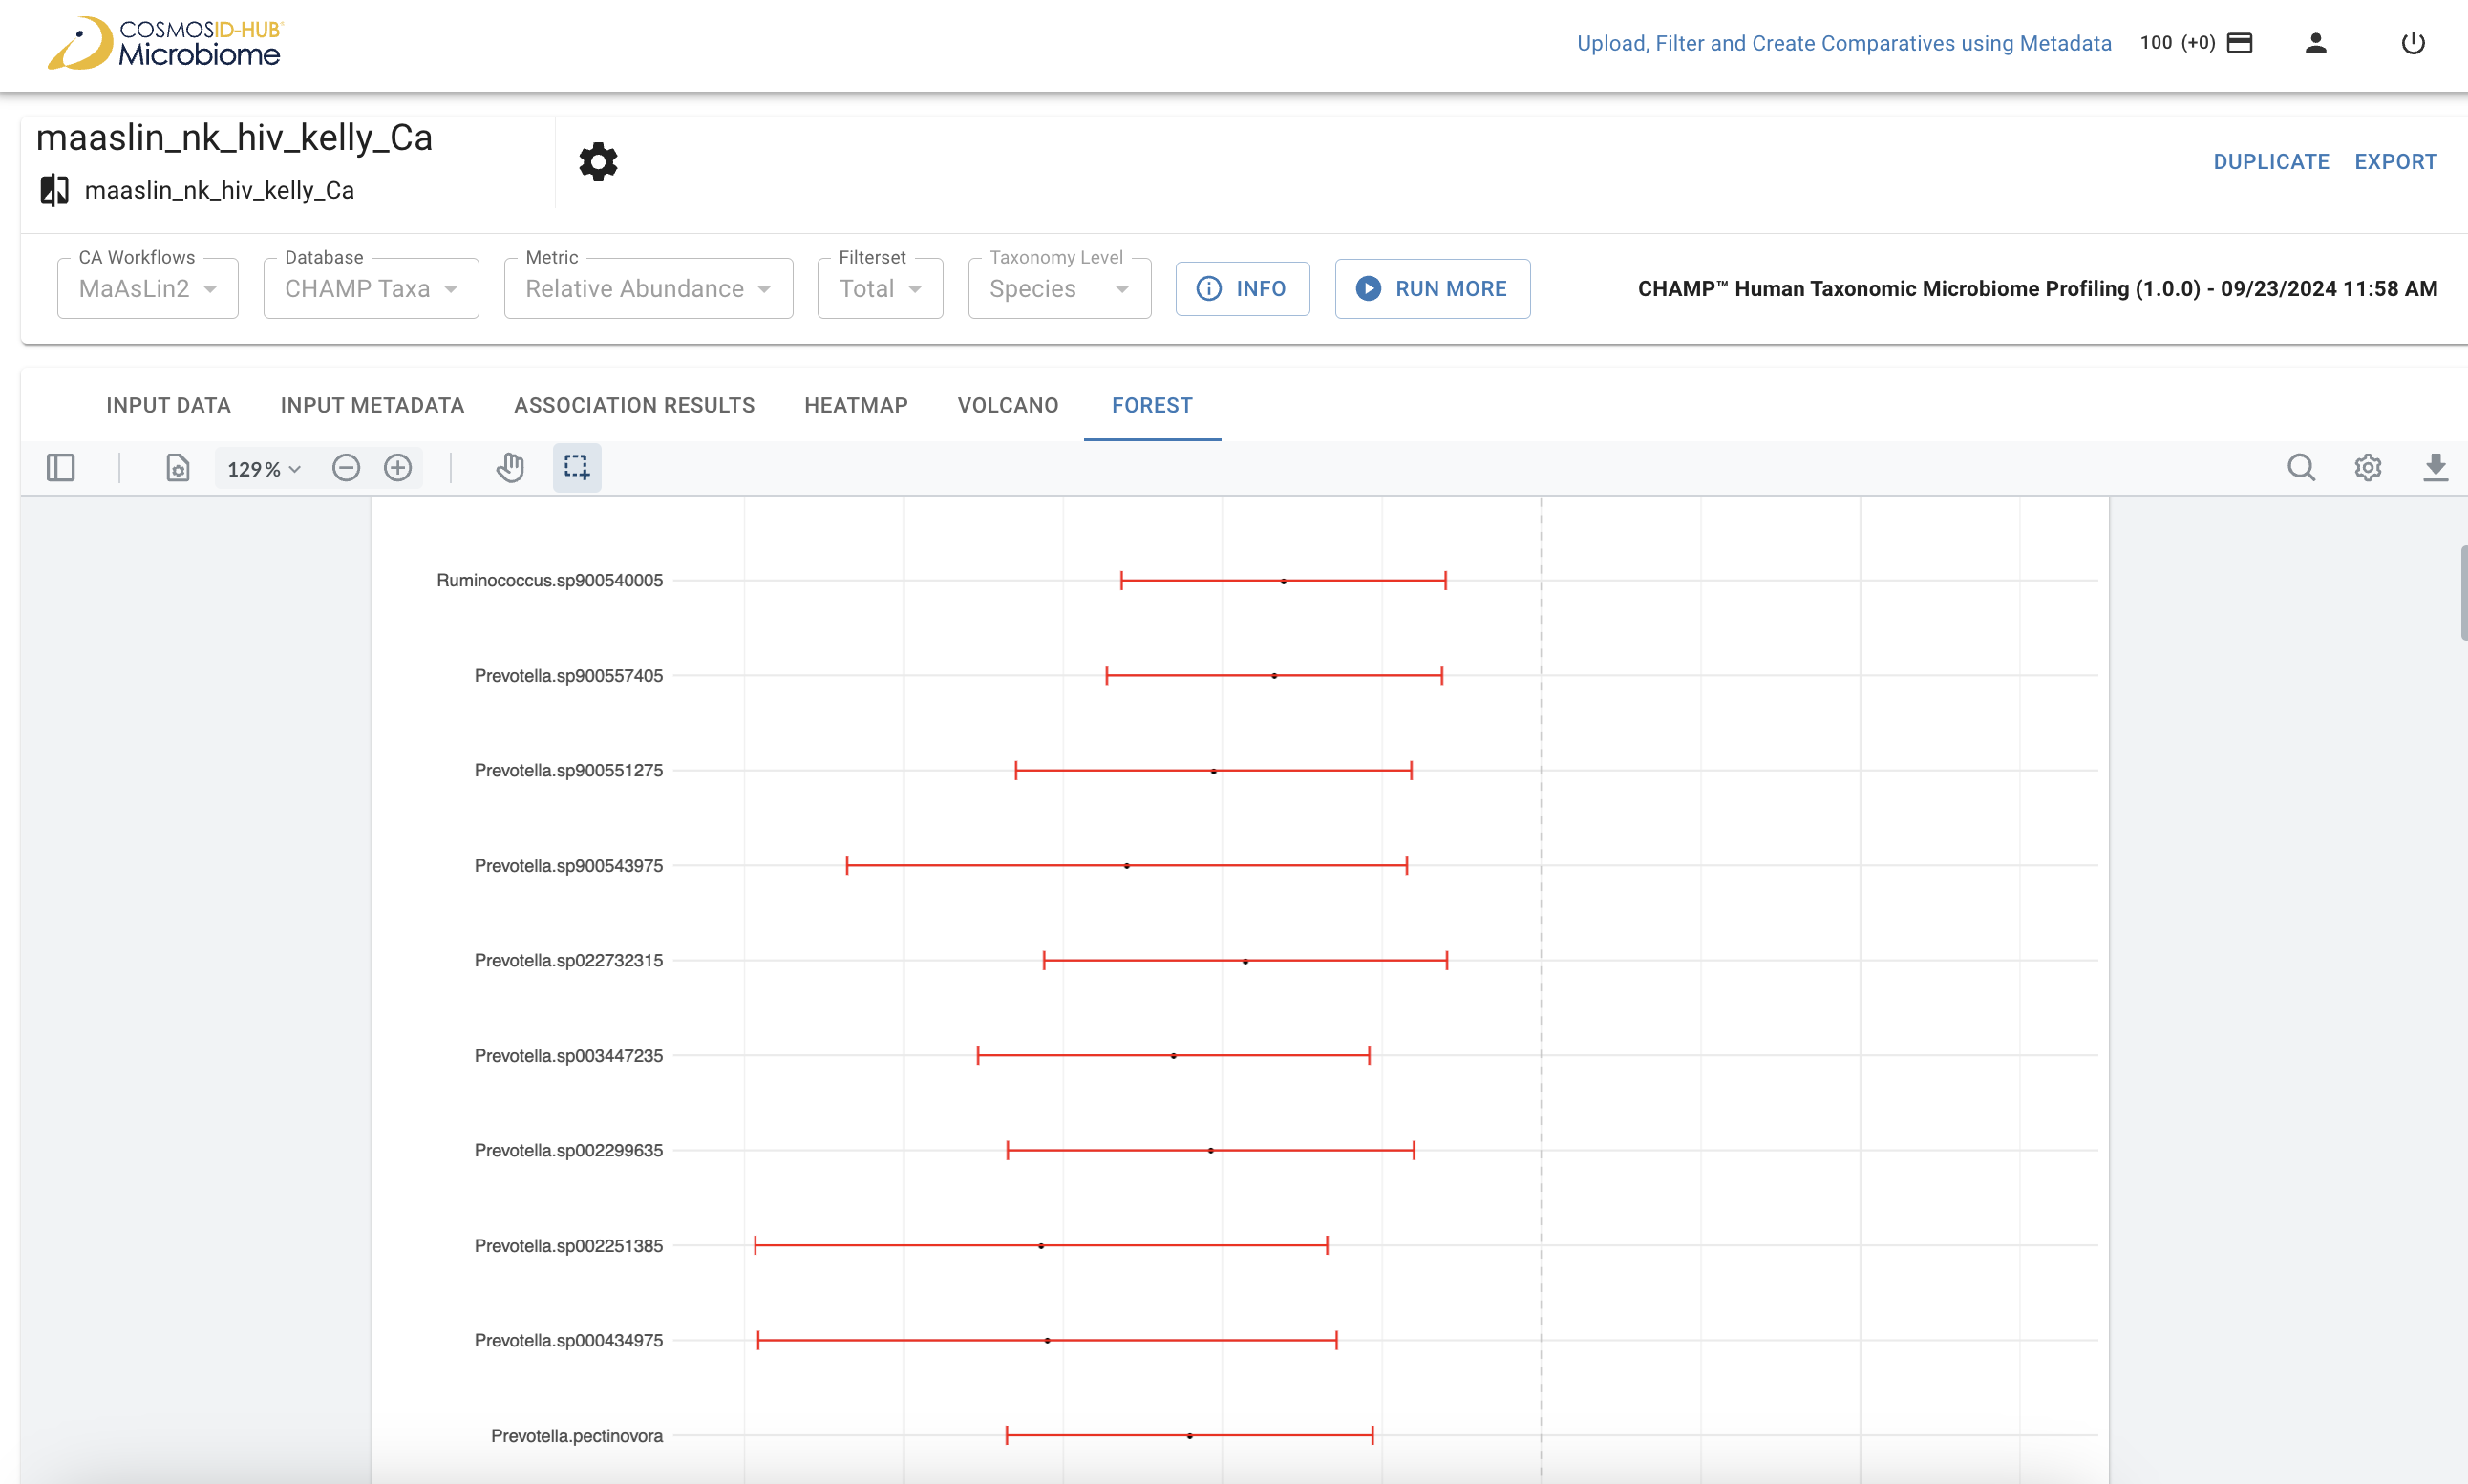
Forest
Forest plot helps to visually summarize the significant features effect size from the model contrasts along with their confidence intervals. X-axis represents the contrast effect size; Y-axis represents the significant features that were found in respective contrasts of interest. The dot and the lines from the dot represents the individual feature’s effect size and the confidence interval of the effect size respectivelyExporting the Data