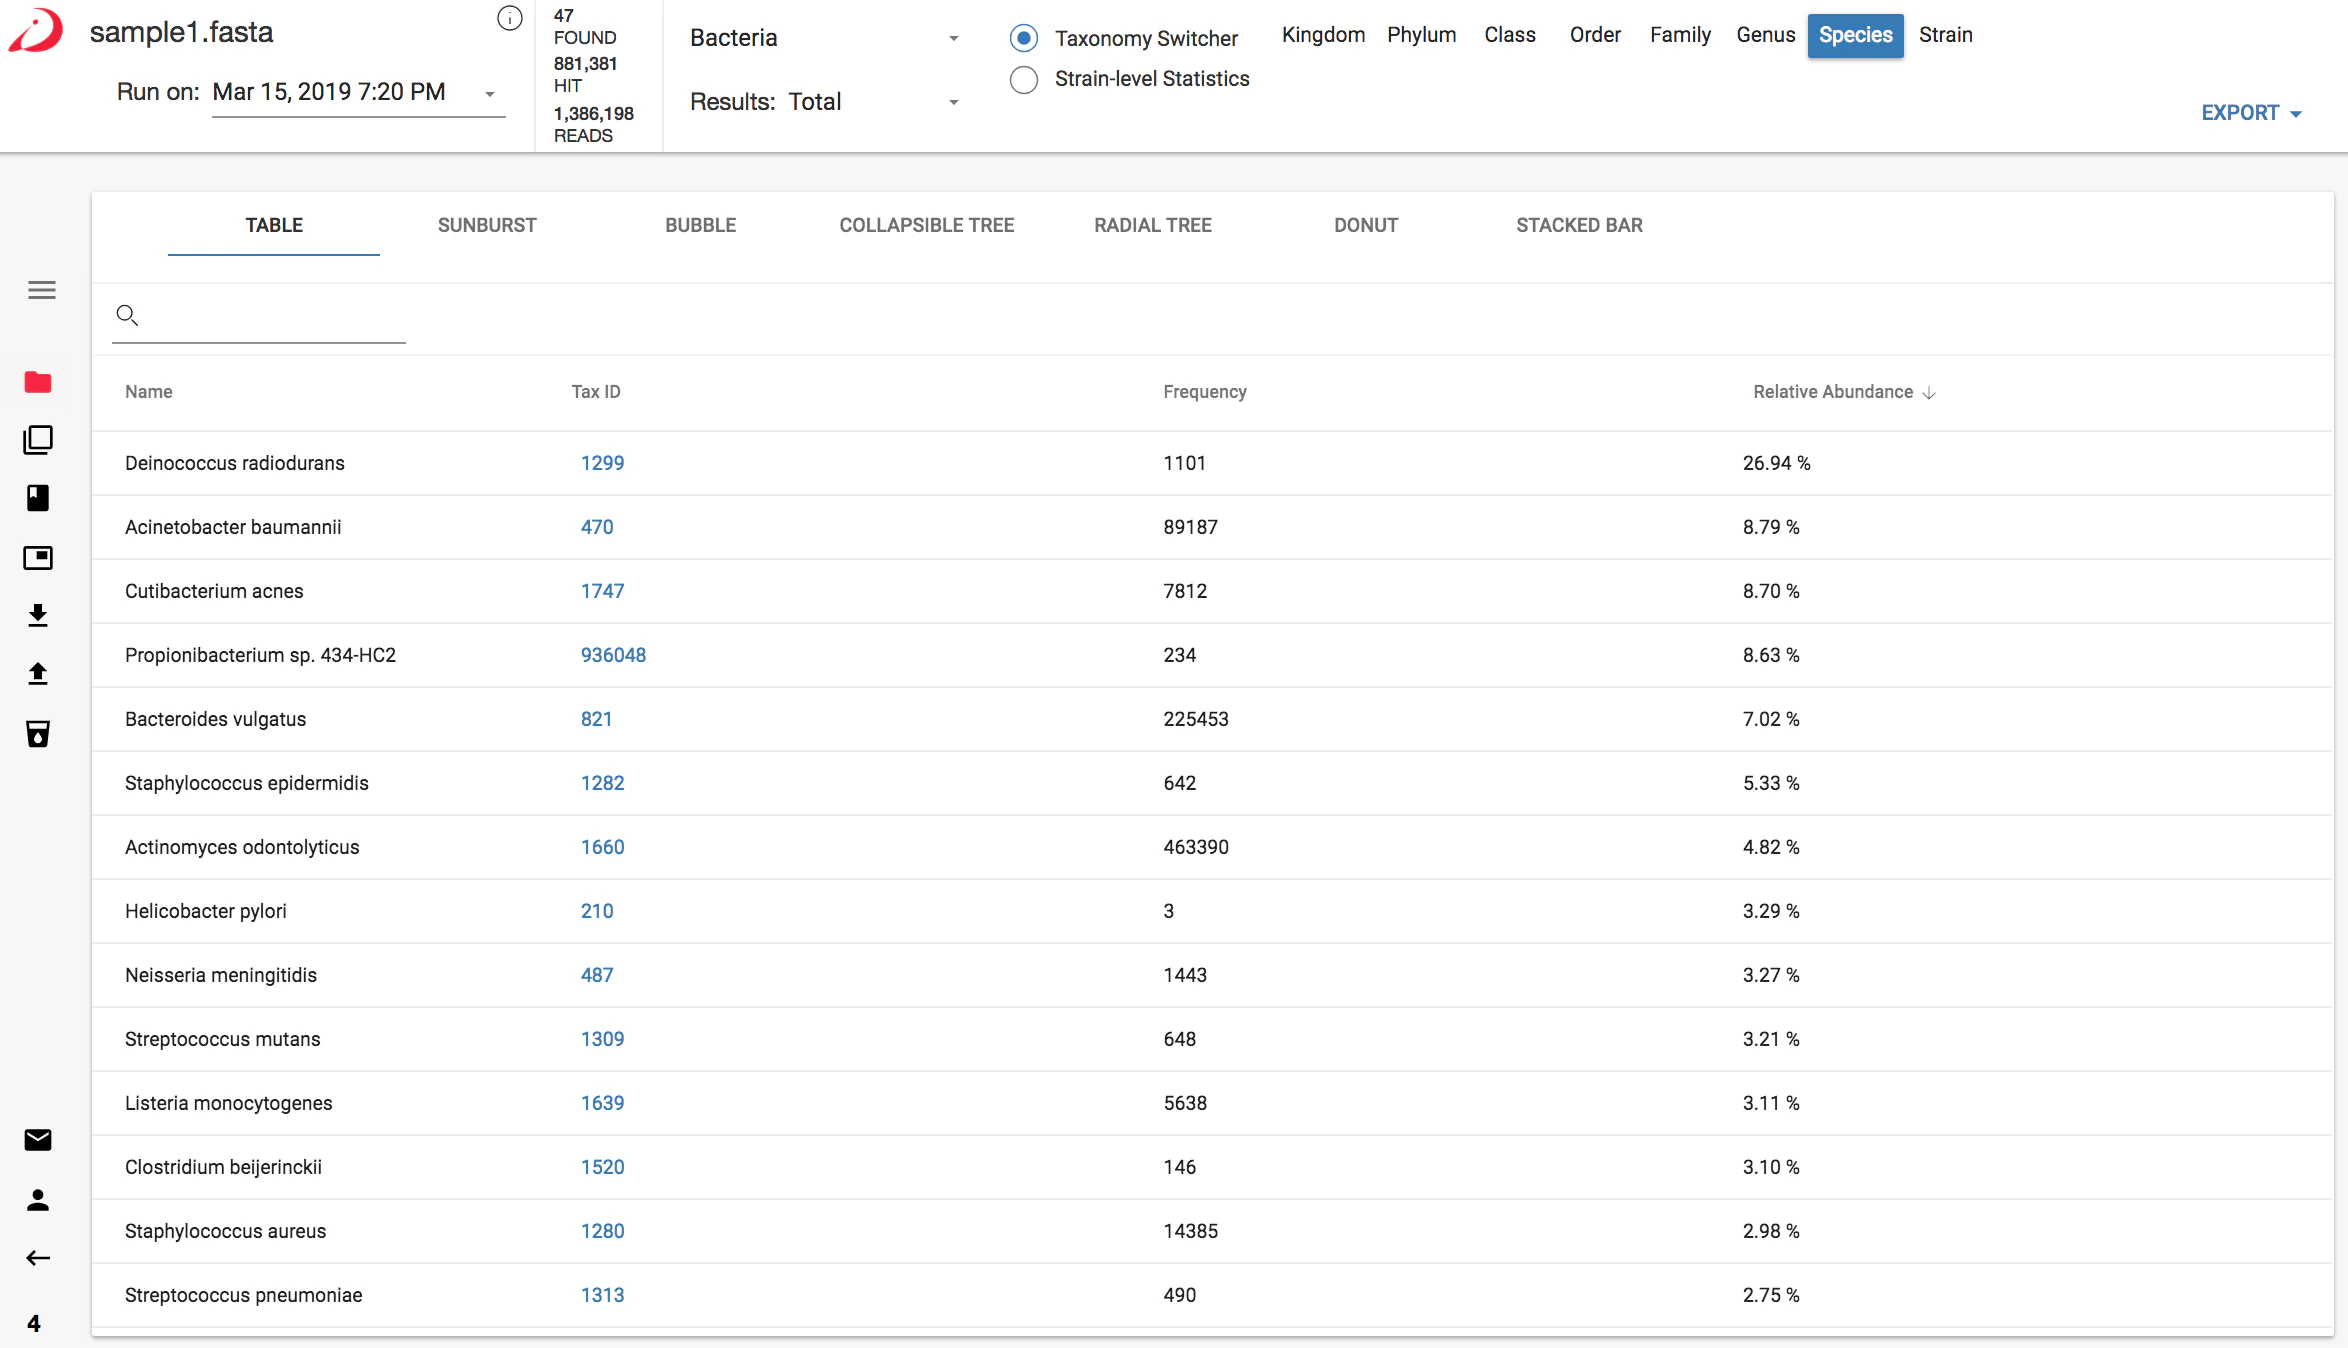
Definition of Columns
- Name - the name of the organism or taxonomic level or the name of the antibiotic resistance gene or virulence factor, depending on the selected database.
- Tax ID - a link to the NCBI taxonomic ID for the organism
- Abundance Score - The Abundance Score is an absolute abundance metric. It is used to calculate the Relative Abundance (%). The abundance score is a normalized metric taking into consideration genome size and number of reads. This makes this metric suitable for downstream comparative analysis or differential abundance analysis.
- Relative Abundance - The Relative Abundance describes the contribution of a given taxon to the total microbial community detected. Relative Abundance is expressed in % and calculated as follows: Relative Abundance = Abundance Score (taxon n) / Sum of Abundance Score (all taxa). This metric is suitable for downstream comparative analysis
- Unique Matches - The number of different kmers found in the sample that are unique to the organism divided by the total number of pre-calculated unique kmers available for the organism in the database. If unique coverage is very low for an organism it could mean a couple of things:
- For strains, this could indicate that the exact strain in our reference database is not a perfect match to the strain in the sample. However, if you also see a high percent TOTAL coverage for this same strain, this is a good indication that a near taxonomic neighbor of the reference strain is in your sample.
- For some organisms that have high representation in sequencing space (E. coli, for example), there may not be many unique areas in the genome available for strain level identification. As more and more similar genomes are added to the database, we trade-off the ability to discriminate between those that are highly similar to each other. This will cause the percent unique coverage to be low.
- Total Matches - The number of shared and unique kmers for the organism divided by the total number of pre-calculated shared plus unique matches available in the reference database. Shared kmers are shared with other similar organisms upwards the same lineage in the phylogenetic tree, which makes this a useful metric for approximating gene coverage, or for assessing the likelihood of a detected taxon or gene actually being present.
- Sort - to sort samples by different columns click on the column name.
- Search - to search for a sample name, click the magnifying glass and enter your search term:
- Frequency - the number of unique kmer occurrences in the queried sample. This is roughly equivalent to the number of reads that matched to the organism identified. See Definitions for more information on how this works.
Switching between visualizations